
The surface zeta potential cell is an accessory (ZEN1020) available for the Zetasizer Nano series of instruments for the measurement of the zeta potential of any flat surface. Further information about the surface zeta potential cell can be found in other application notes available from the Malvern website [1, 2].
Determination of the surface zeta potential is achieved by placing a sample of the surface of interest between the two electrodes of the surface zeta potential cell accessory. The vertical position of the sample is moved with respect to the detection optics by an adjuster at the top of the cell. The cell is placed in a standard 12mm2 cuvette filled with a dispersant and tracer particles and the cuvette and cell inserted into the Zetasizer Nano instrument. Further information on the methodology can be found on the Malvern website [1, 3].
For monovalent counter ions, a linear relationship passing through the origin is expected between the surface zeta potential and ionic strength [4]. This application note discusses the influence of sample ionic strength on surface zeta potential by studying the effect of various concentrations of a monovalent salt on two different surfaces.
KCl, KOH and HCl were all obtained from Sigma-Aldrich (Dorset, UK). The PTFE was acquired from Goodfellows (Huntingdon, UK) and the polycarbonate sample was taken from a DTS1060 folded capillary cell (Malvern Instruments Ltd, Malvern UK).
Samples of each surface were prepared so that they were between 4mm and 8mm in length, less than the spacing of the electrodes, and were generally no more than 1.5mm in thickness. The tracer particles used were Coffee Compliment milk substitute obtained in the UK in predispersed form from Premier Foods.
Various concentrations of KCl between 0.1mM and 50mM were prepared and adjusted to pH 9 with the KOH and HCl. The PTFE and polycarbonate samples were analyzed with the surface zeta potential accessory with a Zetasizer Nano ZS instrument. All measurements were performed at a temperature of 25°C.
Increasing salt concentration increases the current passed for the same field strength which can cause Joule heating and polarization concentration effects. This can result in increased uncertainty in the recorded particle mobility. In order to avoid Joule heating, the conductivity of the sample was measured before and after the electrophoresis measurement and the field strength titrated down until the difference in conductivity and therefore sample temperature was negligible.
|
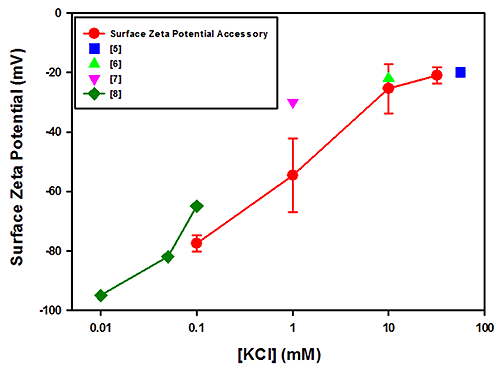
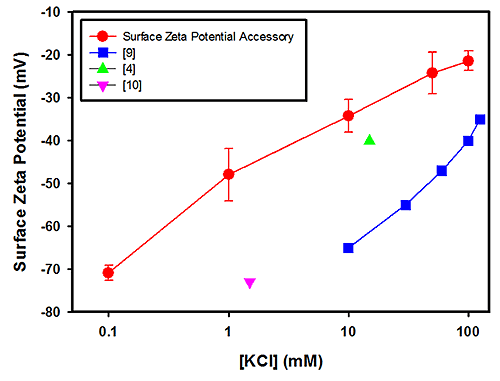
Figure 1 plots the surface zeta potential results (in mV) obtained for PTFE as a function of the log KCl concentration. The plot also contains results obtained from other published studies [5-8]. The results obtained from the polycarbonate measurements are shown in Figure 2 together with data from other published studies [4, 9 and 10].
|
The field strengths and integration times used for these measurements showed no relationship between the uncertainties in the measurements and salt concentrations. The uncertainties in the PTFE data are of the order of the spread in the mean results from all techniques and significantly less so for the polycarbonate case.
A linear relationship between the surface zeta potential and salt concentration is expected for monovalent counter ions [4]. The polycarbonate surface zeta potential cell data are self-consistent in that they fit linearly, but there is considerable variation amongst the references. Since both the surface zeta potential cell and other published data [9] are linear, then the difference can be attributed to a genuine difference in sample properties such as surface smoothness. For example, the polycarbonate surface used in this study was a small block removed from a moulded part with a highly polished surface.
The PTFE results are in good overall agreement with the literature values.
This application note summarizes the influence of ionic strength on the surface zeta potential of PTFE and polycarbonate using the surface zeta potential cell accessory for the Zetasizer Nano.