The stability of a protein sample and its tendency to aggregate is explored using a combination of SEC-MALS and DLS
All biopharmaceuticals are subject to extremely high regulatory burdens which must be met to show their efficacy and safety. One particular area of regulatory scrutiny for biologics is their stability and the level of aggregate material that they contain. Tools that can be used to study protein stability and aggregation provide valuable information for regulators and assist developers to produce safe, reliable, high quality products. Using orthogonal technologies for complementary analyses increases confidence in the resulting data.
Size exclusion chromatography (SEC) and light scattering are two workhorse techniques for biopharmaceutical stability and aggregation analysis. SEC is regularly used to assess the aggregation state of protein samples throughout the drug development pipeline. Static light scattering (often referred to as multi-angle light scattering (MALS)) is used to measure protein molecular weight (MW). Dynamic light scattering (DLS) is used to detect early aggregates and also to monitor aggregate formation in response to stimuli such as time or raised incubation temperatures. These two techniques used together provide a wealth of important information about the stability and aggregation profile of a sample, whilst conserving sample volume and operator time and effort.
The Viscotek SEC-MALS 20 is a modular multi-angle light scattering detector that is easily integrated into any SEC system, allowing measurement of the absolute MW of a protein as well as the radius of gyration (Rg) of any aggregates more than 15 nm in radius. This provides vital information on the stability of the protein. The 20 measurement angles, particularly the additional low angles, generate the most accurate MALS data.
But sometimes measuring MW is not enough, especially when conformational changes that do not have an effect on the protein’s MW may be occurring. The addition of an online DLS detector to an SEC system provides the hydrodynamic radius (Rh) across the entire size range of the sample. In combination with the absolute MW supplied by the SEC-MALS 20, Rh data can give invaluable insight into protein conformation.
The Malvern Zetasizer µV (ZMV) is a highly sensitive dual capability light scattering detector which can be integrated with the SEC-MALS 20 detector to provide Rh data in flow mode during SEC experiments. Alternatively, it can be used independently in cuvette mode for detecting and monitoring aggregate formation. The system allows investigation of the effect of temperature on the stability of a sample, as well as measurements of the second virial coefficient (B22 or A2) and DLS interaction parameter (KD), indicators of the protein’s stability and propensity to aggregate.
When the SEC-MALS 20 and ZMV are used in flow mode, a single powerful software package - OmniSEC - is used to control the system and analyze data. When the ZMV is used in cuvette mode, the Zetasizer software is used for data acquisition and analysis.
In this application note the use of combined inline SEC-MALS and DLS to assess a protein sample’s stability and tendency to aggregate is explored.
Malvern Instruments’ SEC-MALS 20, ZMV and refractive index (RI) detectors were coupled in series to a GPCmax chromatographic system equipped with an autosampler. A single Malvern PLS5030 silica SEC column was used to separate samples by SEC.
OmniSEC v5.1 BIO software was used to control the GPCmax and to acquire and process data.
A human IgG sample was prepared at 1.23 mg/mL in phosphate buffered saline (PBS) pH 7.4. The same PBS buffer was used as the eluent during separation.
The chromatogram in Figure 1 shows the SEC-MALS 90° (orange), RI (red) and DLS (black) traces for the human IgG sample. The DLS data points represent individual DLS measurements of the sample as it elutes from the column.
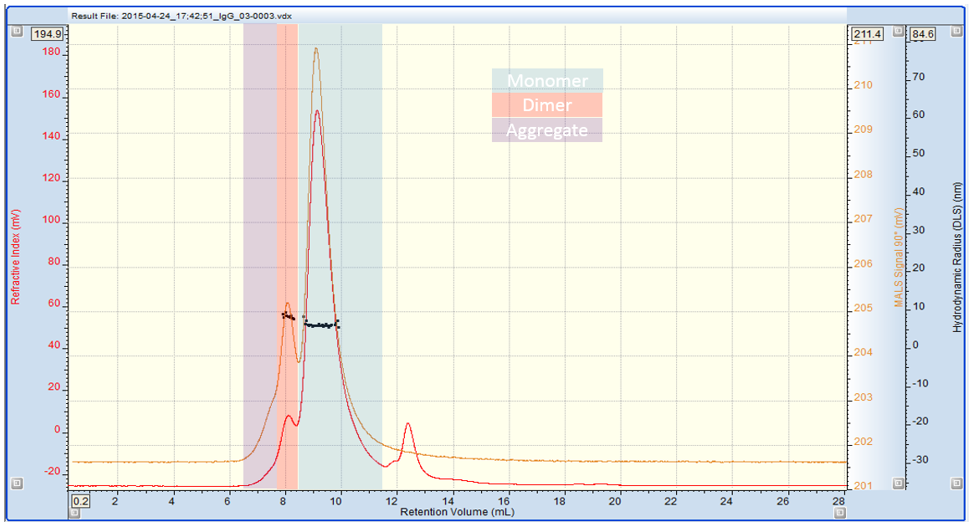
Figure 1: Multi detection chromatogram of IgG. Refractive Index (RI) = Red, SEC-MALS 90° = Orange, Rh by DLS = black
OmniSEC software enables production of SEC-MALS 20 3D plots and DLS correlograms, shown in Figure 2.
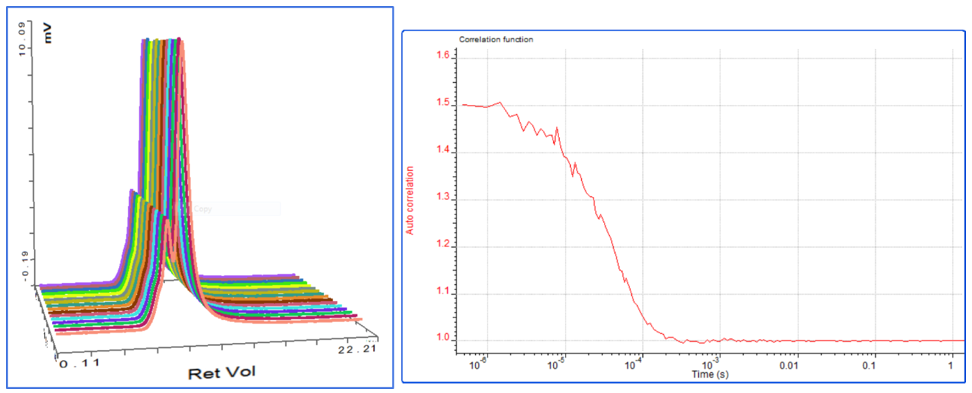
Figure 2: Example SEC-MALS 20 3D plot (left) with ZMV correlogram (right)
Three IgG species are present in clearly defined regions of the trace: monomer, dimer and some higher MW aggregate. The data in table 1 shows the absolute MW, % weight fraction, Rh and Rg of the sample. Using DLS we can measure the Rh of the monomer and dimer. It is not possible to measure the Rh of the aggregate due to its low concentration (less than 2% of the sample). However, it is possible to measure its Rg using the SEC-MALS 20 detector, as its radius is larger than 15nm. Used together, these techniques provide a wealth of information about the IgG sample which can be used to profile its stability.
| Parameter measured | Aggregate | Dimer | Monomer |
|---|---|---|---|
| MW (kDa) | 490 | 301 | 150 |
| Weight fraction (%) | 1.9 | 9.6 | 88.5 |
| Rh by DLS (nm) | N/A | 8.2 | 5.9 |
| Rg by MALS (nm) | 20.6 | N/A | N/A |
To change the ZMV from a flow mode detector to cuvette mode takes seconds, requiring the user to simply replace the flow mode cell for a batch cuvette (Figure 3). Cuvettes to suit various sample volumes are available: disposable cuvettes (1 mL or 50 µL), quartz cuvettes (12 µL or 2 µL) and glass cuvettes (1 mL).
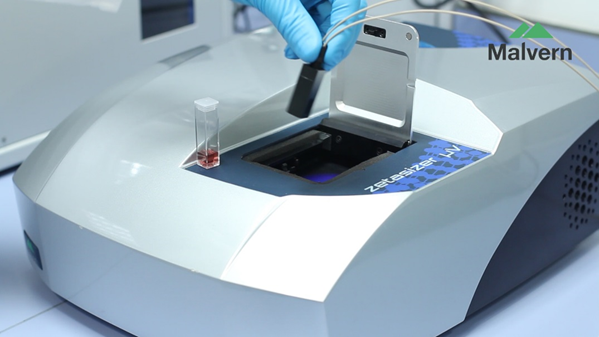
Figure 3: Changing ZMV from flow mode to cuvette mode analysis
Zetasizer software v7.11 was used to collect and process data. The same human IgG sample which was prepared previously at 1.23 mg/mL in PBS pH 7.4 was used.
Batch DLS measurements were performed at 25°C. The thermal stability of the sample between 50°C and 70°C was also assessed.
DLS measures the time-dependent fluctuations in light scattered from molecules in a solution, in order to determine the translational diffusion coefficient and subsequently calculate the Rh using the Stokes-Einstein equation. Cumulants analysis is used to derive the z-average size, which is the intensity-weighted mean size of a sample. The amount of light scattered by a sample is proportional to its diameter to the power 6, making this technique sensitive to the presence of even a few aggregate precursors in a sample, and providing early warning of protein instability.
Figure 4 shows the overlay of 3 correlograms for human IgG produced using the 2µL quartz cuvette.
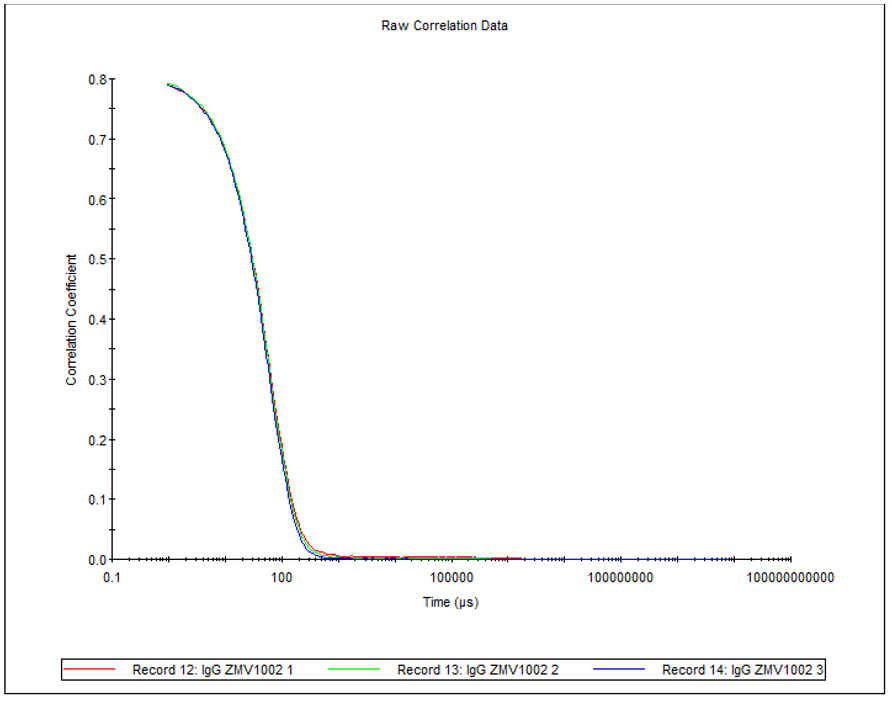
Figure 4: Overlay of 3 correlograms for human IgG
The size distribution by intensity (Figure 5), the z-average and polydispersity index (PDI; Table 2) of the sample can all be determined. The recorded z-average is slightly higher than the Rh determined by SEC for the monomer because cuvette DLS measurements are comparatively low resolution. The technique provides a size measurement of the whole sample, i.e. monomer, dimer and aggregate combined, as represented by the PDI of the sample, which suggests a medium distribution. In addition to this, the presence of a small amount of larger aggregates can clearly be seen in the size distribution.
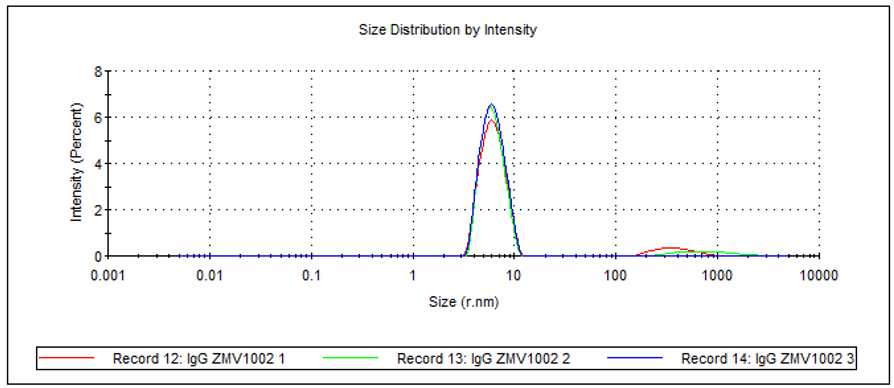
Figure 5: Overlay of 3 measurements of human IgG
| Z-Average | PDI | |
|---|---|---|
| Measurement 1 | 6.2 | 0.208 |
| Measurement 2 | 6.2 | 0.174 |
| Measurement 3 | 6.1 | 0.179 |
In thermal stability measurements, the sample scattering intensity and Z-average are used as parameters to assess the aggregation of proteins. Here, a 50 µL disposable cuvette was used to determine the aggregation point of human IgG in PBS. An aggregation point of 62.5°C was measured. This indicates the point at which the presence of aggregation precursors have become significant, and is a clear sign of protein instability.
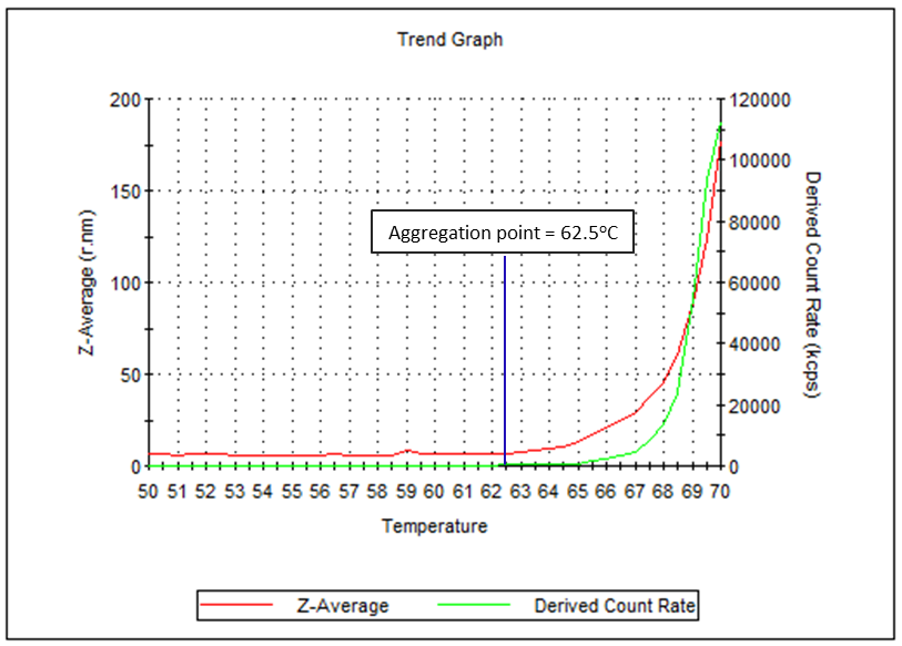
Figure 6: Temperature trend graph showing Z-average and derived count rate between 50°C and 70°C
Conclusions
The results presented in this application note provide a comprehensive picture of the stability of this IgG sample. The SEC data shows that while the sample is primarily monomer, it also contains a small amount of oligomers and higher order aggregates whose size and molecular weight can be measured with light scattering. The combination of Rh and Rg allows size to be measured across the whole size range.
The DLS measurements are in agreement with this and show the sample to be slightly polydisperse, containing more than just the monomer species. However, DLS was also able to detect a very small amount of larger material above 100nm in size. In this case, DLS provides a qualitative indication that larger material is present and may need investigating further. This kind of orthogonal information is critical to a complete characterization of such a protein sample.
Temperature trend DLS measurements are often used as an indicator of long-term sample stability. The result shown here could be compared with analysis of different formulations to indicate which might be the most stable over a long period and ideal for taking forward for development of the final drug product.
Two further stability parameters can be measured using the ZMV in cuvette mode: the second virial coefficient (A2 or B22) and the DLS interaction parameter (kD), both of which provide additional information on product stability and tendency to aggregate.
The combination of these two technologies therefore provides significant complementary information about samples of proteins such as IgG. DLS can be used as a quick, qualitative tool to detect the presence of oligomers and aggregates through increased PDI and size distribution. It can also be used to perform experiments such as temperature trending, which provide indicative information about longer term stability. On the other hand, SEC with light scattering can be used to study the sample’s aggregation state in detail, providing the quantitative information required for regulatory submission.
The practical benefits of combining these two powerful technologies are clear. A complete stability profile can be performed on a single aliquot of sample, minimizing waste and effort and maximizing time and cost savings and also information extracted. In addition, the ability to separate the ZMV from the SEC system in only a few seconds provides exceptional versatility.