This application note will describe the analysis of three antibody samples using column calibration and multi-detector SEC. Comparisons will be made between the data derived from both methods highlighting the advantages of advanced detection.
Antibodies have generated keen interest from the pharmaceutical / biopharma / biotherapeutic industries due to their ability to direct their neutralization attack toward specific structures in harmful agents. As a naturally occurring class of molecules, developments have been made that now allow scientists to produce antibodies in laboratory settings. Since much of an antibody’s functionality depends on its molecular structure and integrity, full characterization, including molecular weight, size, and purity of these materials is critical to ensure efficacy.
Size-exclusion chromatography (SEC), also referred to as gel permeation chromatography (GPC), is a widely used technique to characterize a range of samples, from bulk manufactured materials to proteins and other biological macromolecules, such as antibodies. This technique can be used to measure the molecular weight moments, molecular weight distribution, intrinsic viscosity and hydrodynamic size of these materials. Figure 1 shows a complete setup of Malvern’s OMNISEC SEC system.
A brief overview of how SEC works: a solvated sample is carried by a liquid mobile phase through an analytical column full of porous gel particles, where diffusion-controlled separation of the macromolecular components occurs and is ultimately observed by different detectors as each slice of sample elutes. The samples elute based on molecular size, with the larger molecules eluting first. It is important to remember that the elution order is based on molecular size and not molecular weight.
The potency of the SEC analysis depends on which detectors are coupled to the chromatography. Two of the common types of SEC configurations are a column calibration SEC setup, and an advanced detection SEC setup. A column calibration SEC system employs a single concentration detector, usually a refractive index (RI) or UV detector, to compare the retention volume of analyte molecules through a SEC column against that of a series of standards with known molecular weights. A common advanced detection SEC configuration utilizes a combination of RI, UV/Vis photodiode array (PDA), viscometer, and light scattering detectors to make direct measurements of samples’ molecular weight, intrinsic viscosity and molecular size, independent of retention volume or elution order.
This application note will describe the analysis of three antibody samples using column calibration and advanced detection SEC. Comparisons will be made between the data derived from both methods highlighting the advantages of advanced detection.
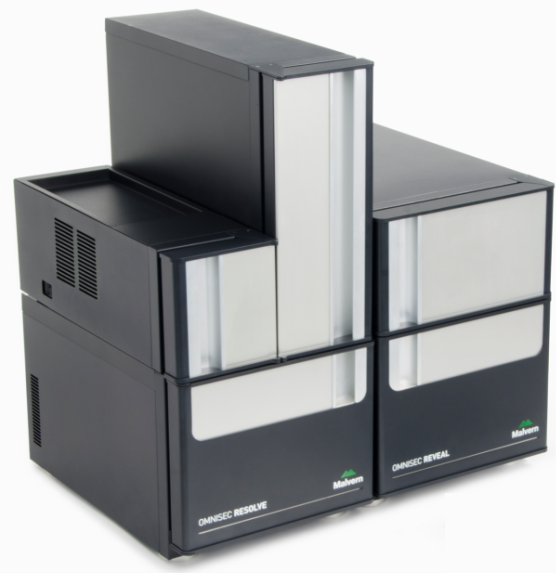
Figure 1: Malvern's OMNISEC tetra-detector SEC system.
Three antibody samples, 1, 2, and 3, were prepared in water at concentrations of about 0.5 mg/mL for SEC analysis using Malvern’s OMNISEC system. The samples were analyzed using 2 × P3000 in a mobile phase of phosphate-buffered saline (PBS) at a flow rate of 0.75 mL/min. The zero-waste mode for volume-economic sample delivery was to inject 100 µL of each sample. The autosampler, column, and detector compartments were maintained at 25 °C throughout the analyses.
The tetra detector chromatograms for the antibody samples are shown in Figures 2–4. The RI signal is presented in red, the UV/Vis PDA signal at 280 nm is purple, the viscometer signal is blue, and the right angle light scattering detector is green. LogMW is presented as a gold line.
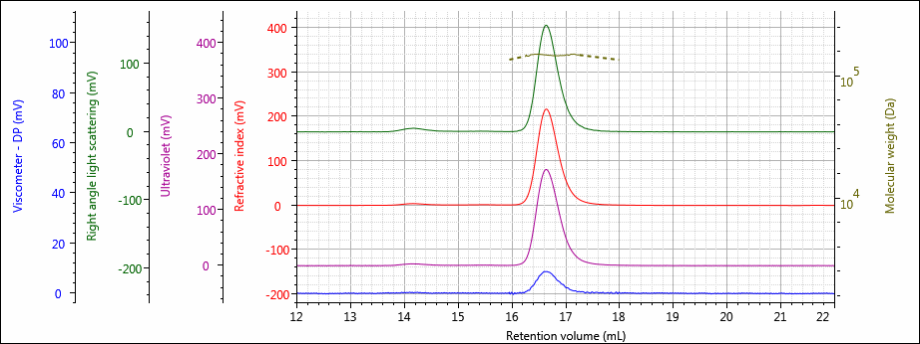
Figure 2: Tetra detector chromatogram of sample 1.
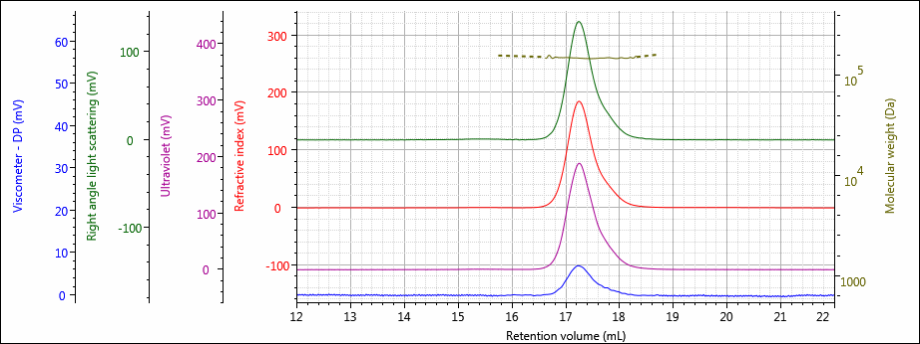
Figure 3: Tetra detector chromatogram of sample 2.
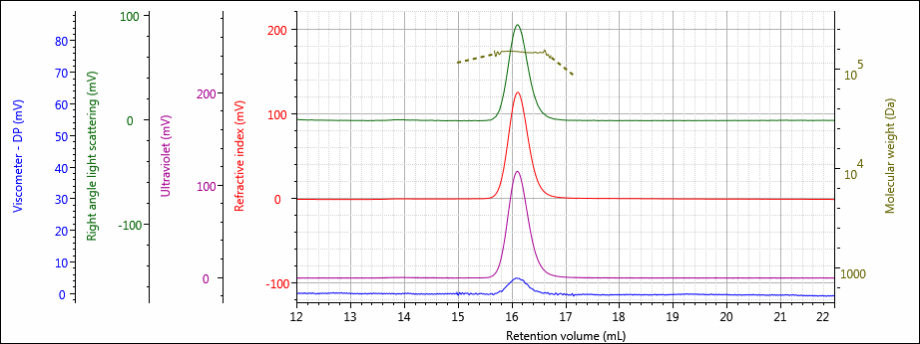
Figure 4: Tetra detector chromatogram of sample 3.
All three samples show good chromatography, as evidenced by the detector signals returning to baseline. A cursory examination of the retention volume of each sample indicates that sample 3 elutes at the lowest elution volume (earliest elution time), followed by sample 1, and then finally sample 2. This trend is highlighted in the overlay of the refractive index chromatograms shown in Figure 5.
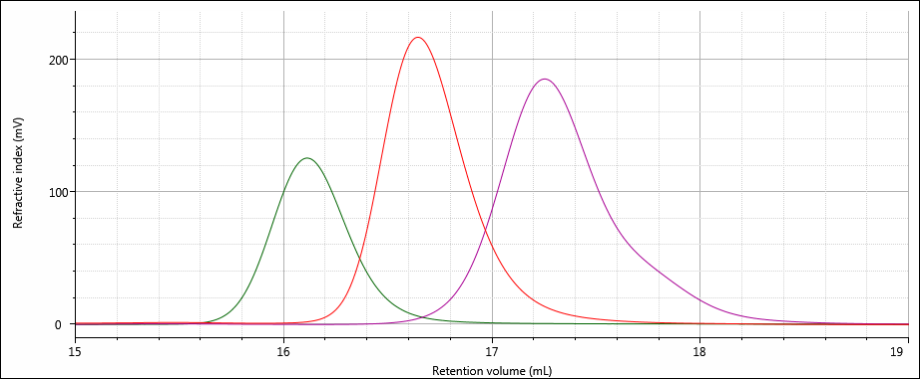
Figure 5: Overlay of refractive index chromatograms of samples 1 (red), 2 (purple) and 3 (green).
The conclusions that can be drawn from this comparison are that sample 3 possesses the largest molecular size of the three samples, followed by sample 1, with sample 2 having the smallest molecular size. It is important to note that the term molecular size was used to make the comparisons based on elution order, not molecular weight. In many cases molecular size and molecular weight follow the same trends, but this is not absolutely true for all samples.
In the following sections, the column calibration and advanced detection data will be discussed. In order to provide a fair comparison between the column calibration and advanced detection analysis methods, the same chromatographic data are used for both sets of calculations.
A protein molecular weight marker kit (Sigma Aldrich) comprising six globular proteins and an exclusion limit marker was prepared in PBS at concentrations of approximately 1-3 mg/mL in order to provide a molecular weight profile for the column set. The molecular weights of the proteins ranged from 29 kDa to 669 kDa. The calibration curve generated is shown below in Figure 6.
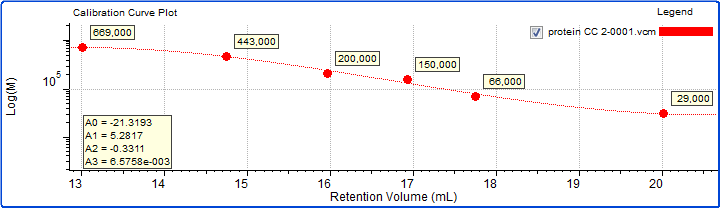
Figure 6: Calibration curve generated from six proteins with established molecular weight values.
The molecular weight and dispersity values calculated for the antibody samples 1, 2, and 3 based on the protein calibration curve are presented in Table 1.
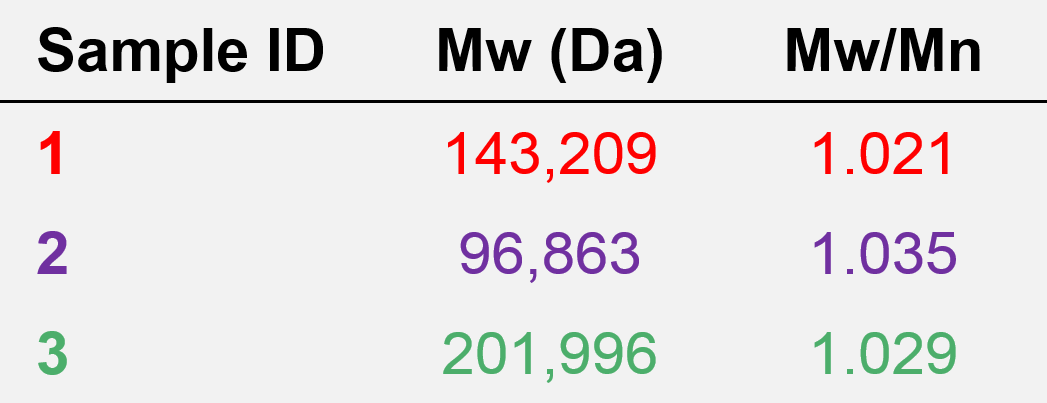
Table 1. Molecular characterization data from column calibration for samples 1, 2, and 3.
As expected based on the elution volumes shown in Figure 5 and the fact that the calibration curve in Figure 6 descends to lower molecular weight with increasing retention volume, the molecular weight calculated for sample 3 was the highest, at about 202 kDa. Next was sample 1 at 143 kDa, and last was sample 2 at about 97 kDa. Based on the calibration curve shown in Figure 6, this range of molecular weights is consistent with the retention volume difference of over 1 mL (~16.1–17.2 mL) from the peak of sample 3 to the peak of sample 2. With a single detector column calibration SEC method, this relative molecular weight, as in relative to the protein standards used to create the calibration curve, is the extent of the molecular data available.
To examine these samples further, the molecular characterization data from advanced detection for samples 1, 2, and 3 (see Figures 2–4) are shown below in Table 2. The combination of concentration detectors with viscometer and light scattering detectors offers more comprehensive data, including the absolute molecular weight (Mw), dispersity (Mw/Mn), intrinsic viscosity (IV), and hydrodynamic radius (RH). The dn/dc used for analysis was 0.185, typical of proteins in aqueous media.
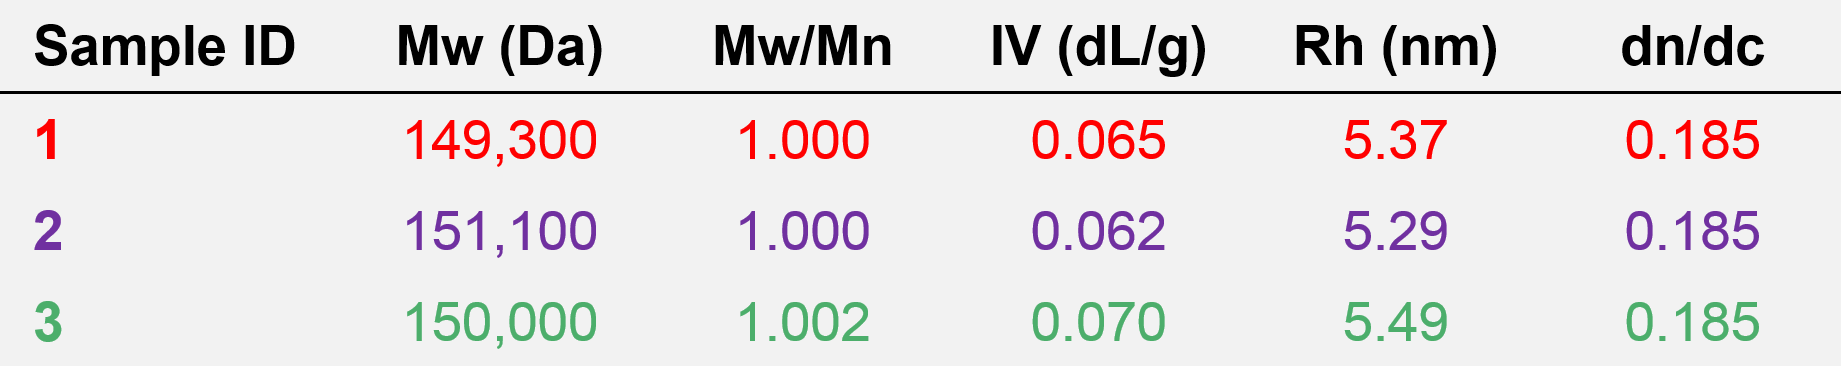
Table 2. Molecular characterization data from advanced detection for samples 1, 2, and 3.
The obvious difference between the data obtained from column calibration and advanced detection is that relative molecular weights calculated from column calibration provided a range of values for the three antibody samples, while the absolute molecular weight data from advanced detection correctly shows that all three antibody samples have the same molecular weight, about 150 kDa. The dispersity values of approximately 1 agree with the flat LogMW trace in Figures 3–5 and indicate that these samples are discrete species. The advanced detection data also supports the molecular size trend observed from the elution order in Figure 5, as sample 3 has the highest IV and largest RH value, followed by sample 1, and last, sample 2. This means that the three antibodies have different molecular shapes, and it is those shape and size differences, not molecular weight differences, that cause them to elute at different retention volumes
If the analysis of these antibody samples had relied solely on column calibration data, the molecular weight information obtained would have been inaccurate. For example, a researcher could come to the false conclusion that antibody sample 2 had a lower molecular weight due to the loss of its L polypeptide chains or that antibody sample 3 had a chemically-bound impurity or had aggregated. When in reality neither of these has occurred, and the different molecular sizes are due to unforeseen structural differences or conformation changes. The use of advanced detection, which employs a light scattering detector to measure absolute molecular weight independent of retention volume, offers accurate molecular weight data and reveals structural details not observable with column calibration techniques. For additional examples highlighting the need for advanced detection in order to obtain accurate molecular information about sample components, please see the related application note: Characterization of IgG monomers & their aggregates.
The data in this application note illustrates one of the most important benefits of advanced detection SEC. While column calibration SEC has been used successfully for many years, it relies on the dangerous assumption that molecular weight always trends with molecular size, and thus retention volume. While many materials exhibit this trend, there are a number of macromolecules with variable structures, such as the antibodies shown here, that do not. Column calibration SEC analysis of these types of materials can lead to dramatically incorrect qualitative and quantitative data and conclusions. Advanced detector SEC can not only measure absolute molecular weight, independent of molecular size and retention volume, but also provide structural information such as IV and RH.
The ability to accurately determine the molecular weight and molecular size of antibodies is critical to provide researchers and manufacturers the information needed in order to maintain the sample purity and integrity required for specific applications. This kind of insight can allow for a deeper understanding, and ultimately control, of the behavior of these valuable materials and their subsequent end-use as therapeutics and other beneficial drugs.