One of the challenges of developing a test protocol for dynamic light scattering measurements is getting the concentration of the sample right. Too low, and our scattering measurement fluctuates erratically as we become sensitive to particles entering and leaving the detection volume. Too high, and our assumptions of single scattering break down and the correlation function no longer represents the data we expect.
Here we will discuss how the new Low Volume Disposable Sizing Cell can help in the latter situation, and extend the measurable range of concentrations that can be reliably probed with a side scattering system.
Please login or register to read more.
One of the challenges of developing a test protocol for dynamic light scattering measurements is getting the concentration of the sample right. Too low, and our scattering measurement fluctuates erratically as we become sensitive to particles entering and leaving the detection volume. Too high, and our assumptions of single scattering break down and the correlation function no longer represents the data we expect.
Here we will discuss how the new Low Volume Disposable Sizing Cell can help in the latter situation, and extend the measurable range of concentrations that can be reliably probed with a side scattering system.
A general rule of thumb for light scattering measurements is that the sample should be ‘water-clear’. This means that we know that the sample does not display multiple scattering, which is what makes more concentrated samples look cloudy or opaque. This is because light entering the sample interacts with more than one particle before it is detected.
There are, however, limitations to this; for example, it may not be possible to dilute samples containing strongly-scattering particles of a larger size to ‘water-clear’ and still have enough particles in the sample to reliably measure. For some colloidal systems, the size of the particles may be concentration-dependent, which means that diluting the sample impacts the system we want to study. For this reason, international standards for DLS recommend performing measurements over a range of concentrations in order to validate the preparation technique[1].
The most versatile approach to handling a wide range of particle concentrations is Non-invasive Back Scatter (NIBS), which combines a wide detection volume to reduce the onset of number fluctuations, with a moveable detection volume to reduce the onset of multiple scattering (Figure 1) [2].
The optical configuration of NIBS means that it can only be implemented in backscattering mode, and measurements performed using a traditional side scattering configuration are limited to only ‘water-clear’ samples using standard cuvettes.
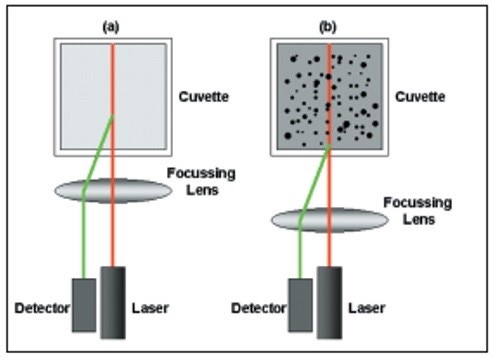
Figure 1: Non-invasive backscatter optics, showing optimization of the measurement position for dilute and concentrated dispersions.
In previous application notes, we have introduced the benefits of the Low Volume Disposable Sizing Cell (LVDSC), the ZSU1002, for low volume measurements [3] and for larger particle sizes [4,5].
The LVDSC comprises a metal holder and a glass capillary with a 1 mm bore which is square in cross-section. The specially-designed holder ensures reliable and repeatable positioning of the capillary within the Zetasizer Advance series instruments with side scatter measurement capabilities.
The small cross-section of the sample means that scattered light is detected with a short optical path through the sample, similarly to an optimized NIBS measurement, and the cell permits measurements at higher concentrations than in a standard 10 mm x 10 mm cuvette (Figure 2).
The data in Figure 2 shows a comparison between the reported Z Average particle size for a sample of NIST-traceable 200 nm latex particles, prepared at a series of concentrations and measured in different configurations. The sample was diluted from its stock concentration in 20 nm-filtered 10 mM NaCl and loaded into DTS0012 cells with a 10 mm x 10 mm cross-section, and 1 mm capillaries for the LVDSC. The optimal measurement process is the use of backscatter detection, with an optimized measurement position as achieved using NIBS. These measurements provide accurate particle sizes within the certified range (black dotted lines) for this sample across all the concentrations prepared, including the stock dispersion.
By contrast, the same sample and cell measured at a 90˚ scattering angle soon falls below the expected particle size, with the neat dispersion giving no valid result. As well as the reduced optical path length, a backscatter configuration helps mitigate the effects of multiple scattering as the artefacts of multiple scattering vary with angle and are less pronounced.
Consequently, backscatter measurements performed at the center of the cuvette give reasonable data slightly beyond the concentration that can be used for side scatter in a 10mm cuvette with a comparable optical path length.
Within a side scatter configuration, the capillary measurements were much better than those performed using a standard cell, with accurate particle sizes reported for a dispersion which was 10x more concentrated. However, the measurements in the capillary were not invulnerable to multiple scattering, and we see a reduced particle size being reported for the neat dispersion.
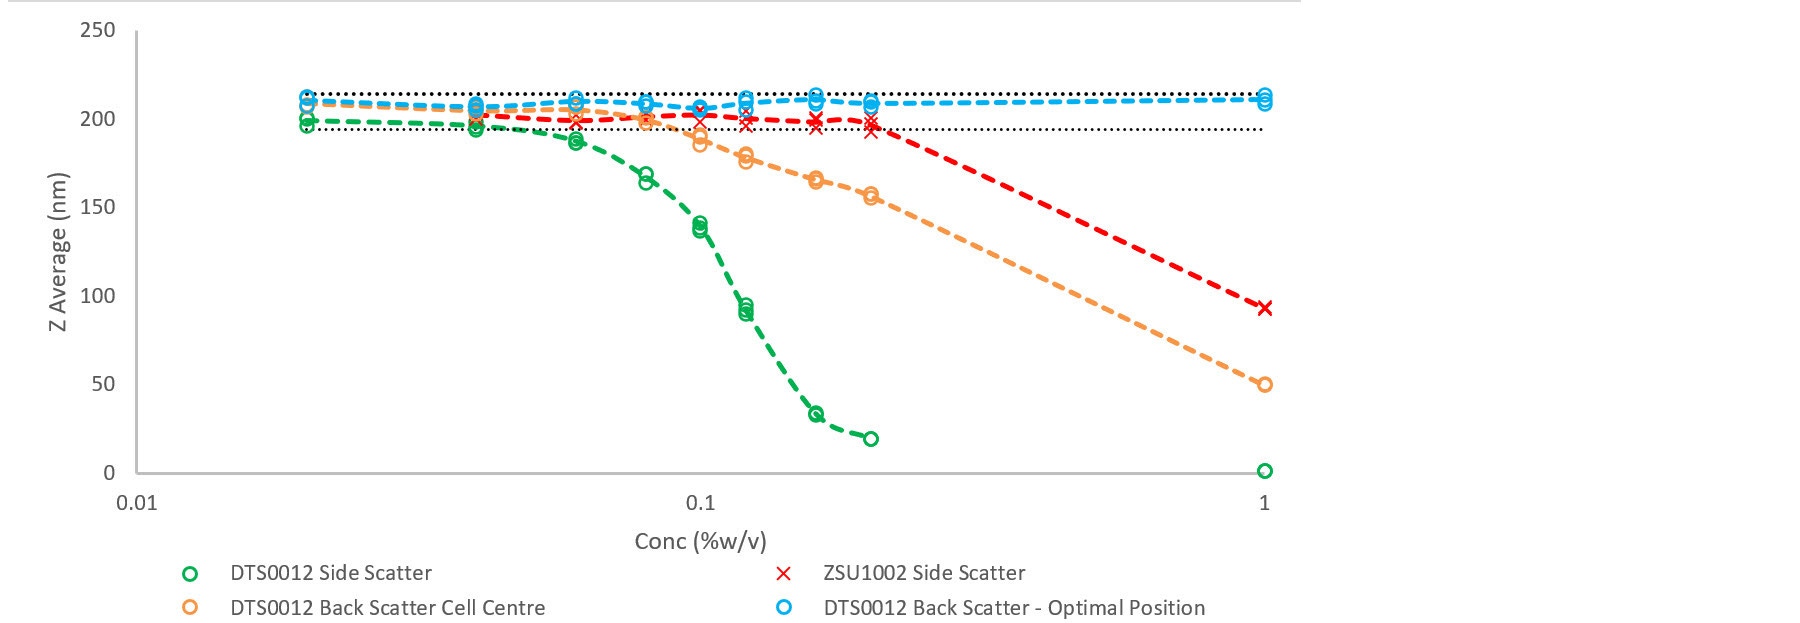
Figure 2: Z Average size as a function of dispersion concentration for a 200 nm latex standard. Measurements in a 10 mm square cuvette were performed in backscatter, with optics focused at the cell center (orange), backscatter with optimized measurement position (NIBS) (blue), and side scatter (green). Capillary measurements performed in a side scatter configuration only (due to the limited cross-section) are also shown (red). The black dotted lines show the certified size range for the standard.
We can see this decline in measurement quality when we look at the particle size distributions and correlation functions for these measurements (Figures 3 and 4) to help us recognize the effect of multiple scattering on our measurements.
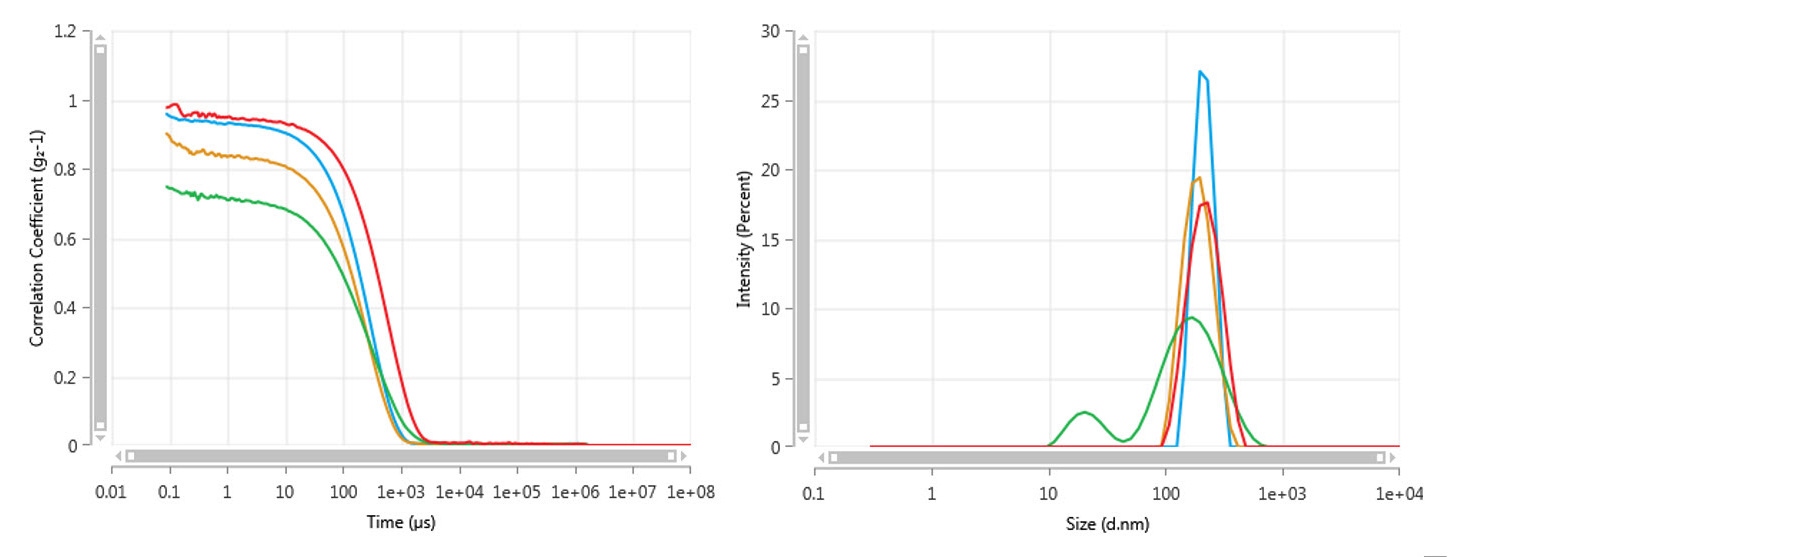
Figure 3: Correlation functions (left) and intensity weighted particle size distributions (right) for a semi dilute dispersion of 200 nm latex, measured using a 10 mm cuvette with optimized position in backscatter (blue), cell center cuvette position in backscatter (orange), and side scatter (green), and a 1 mm capillary in side scatter (red). Note that the optimized backscatter and capillary measurements both have a high correlation intercept and report a comparable particle size. These results do show a different decay in the correlation function, which is due to the angular dependence of the rate of decay of the correlation function.
For a semi-dilute dispersion, NIBS and capillary measurements both give a well-defined particle size and correlation function, with correlation intercepts both close to 1. The intercept is a measure of signal to noise of the measurement and is reduced when any light which is not singly scattered by the sample is detected. The back-scatter measurement performed at cell center gives a similarly well-defined particle size distribution, but we can see that it is shifted towards a smaller size. Without any other information we may not spot an issue with this measurement, but we can see however that the correlation function intercept is now reduced. When setting up a size measurement on the Zetasizer, automatic optimization is recommended wherever possible to detect and account for this.
For a semi-dilute dispersion, NIBS and capillary measurements both give a well-defined particle size and correlation function, with correlation intercepts both close to 1. The intercept is a measure of the signal-to-noise ratio of the measurement and is reduced when any light which is not singly scattered by the sample is detected. The backscatter measurement performed at cell center gives a similarly well-defined particle size distribution, but we can see that it is shifted towards a smaller size. Without any further information we may not spot an issue with this measurement; however, we can see that the correlation function intercept is now reduced. When setting up a size measurement on the Zetasizer, automatic optimization is recommended wherever possible to detect and account for this.
The side scatter measurements for the 10 mm x 10 mm cuvette show a reduced size but also a phantom additional component of the sample. This is due to the multiple-scattered light having different rates of fluctuation to the single-scattered light, giving the appearance of an additional sample component. In this case, we know this is an artefact as we have prepared a known sample, but again we can see that the correlogram has a much lower signal-to-noise ratio which would be unexpected for a sample that scatters light reasonably well (note that low-scattering samples such as proteins at low concentration may also exhibit a low correlation intercept).
The NIBS measurement of the neat latex dispersion gives a well-defined particle size peak and correlation function, with an intercept close to 1. The capillary measurement has the next best signal quality/intercept, but we also see some artefacts in the particle size distribution which were seen in a larger cuvette at a much lower concentration. The backscatter and side scatter results measured from the center of a 10 mm x 10 mm cuvette both show increasing suppression of signal-to-noise.
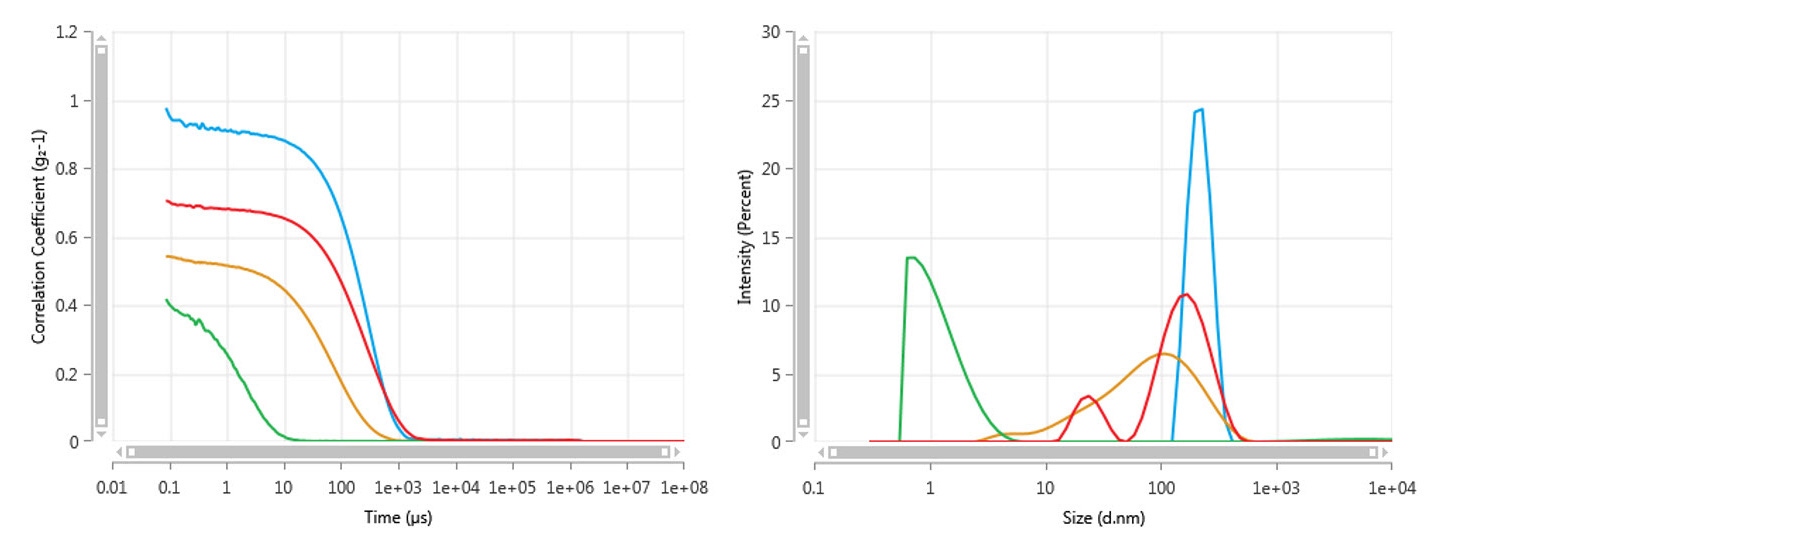
Figure 4: Correlation functions (left) and intensity weighted particle size distributions (right) for a stock dispersion of 200 nm latex, measured using a 10 mm cuvette with optimized position in backscatter (blue), cell center cuvette position in backscatter (orange), and side scatter (green), and a 1 mm capillary in side scatter (red). Whist the optimized backscatter measurement still presents good data quality and accurate size, all other measurements are compromised by multiple scattering, with broad artefact peaks being reported in the particle size distribution.
The most versatile method for measuring a wide range of concentration dispersions by DLS is the NIBS optical configuration of the Zetasizer Pro and Ultra, but the new capillary DLS cell can allow measurements over a much wider range of samples than previously possible when using traditional side scatter DLS. The ZSU1002 Low Volume Disposable Sizing Cell is unique to the Zetasizer Lab and Zetasizer Ultra, and is a useful tool for characterizing a wide range of samples using DLS.
[1] ISO 22412:2017 – Particle size analysis – Dynamic Light Scattering https://www.iso.org/standard/65410.html
[2] Explaining the difference between Non-Invasive BackScatter (NIBS) and Backscatter – they are NOT the same. https://www.malvernpanalytical.com/en/learn/knowledge-center/technical-notes/AN151119NIBSvsBackscatter
[3] Do less with more – Performing DLS measurements using the Low Volume Disposable Sizing Cell. https://www.malvernpanalytical.com/en/learn/knowledge-center/technical-notes/TN180518UsingLowVolumeCellUltra
[4] Pushing the limits of DLS: Measuring large particles on the Zetasizer Ultra with the Low-Volume Sizing Cell https://www.malvernpanalytical.com/en/learn/knowledge-center/application-notes/AN180516LargeParticlesZetasizerUltra
[5] V. Ruseva, M. Lyons, J. Powell, J. Austin, A. Malm & J. Corbett, Capillary dynamic light scattering: Continuous hydrodynamic particle size from the nano to the micro-scale, Colloids and Surfaces A, 558, p504-511 (2018).