This application note describes the use of a PreFIX Slurry Flow Cell for research-scale crystallization experiments on a Malvern Panalytical X-ray diffractometer. Transmission experiments were performed to monitor and analyze crystallization processes from the very first stages up to high crystallite concentrations.
The basics of crystallization, such as the fundamentals of thermodynamics, kinetics, and structure, are well established. However, the application of these basics to solve crystallization process problems is complicated with a large number of tools for the practicing scientist or engineer to make use of.
The basics of crystallization, such as the fundamentals of thermodynamics, kinetics, and structure, are well established. However, the application of these basics to solve crystallization process problems is complicated with a large number of tools for the practicing scientist or engineer to make use of. Control of crystal size distributions, polymorphs, impurity-crystal interactions, and morphology (shape) are a few of the key areas in current research with multiple approaches under evaluation. Most approaches are targeted to become so-called ‘PAT’ solutions: Process Analytical Technology (PAT) is the design and control of manufacturing processes through real- time measurements with the goal of ensuring final product quality. A typical experimental apparatus for batch crystallization may utilize various in situ sensors to monitor the crystallization process.
Among the instrumental techniques that have gained prominence so far are near infrared (NIR) and Raman spectroscopy for monitoring polymorphic forms, FT-IR spectroscopy for monitoring solution concentration and Focused Beam Reflectance Measurement (FBRM) and Process Video Microscopy for understanding particle size, particle shape, and particle population. This application note describes the use of a new Slurry Flow Cell in research-scale experiments to prove the excellent suitability of the X-ray diffraction technique (XRD) to act as on-line sensor. The Slurry Flow Cell is integrated in a XRD system and allows the real-time monitoring and analysis of solid phase growth and polymorphic phase transformation during the crystallization process. Since on-line analysis also enables the detection and analysis of intermediate products it is very useful for the understanding of the processes and process kinetics in order to get the final product. This process understanding is the most critical part for a QbD (Quality by Design) approval. Information about parameters that influence the crystallization process (solvents, concentrations, pH, stirrer geometry and speed, reactor geometry, temperature, temperature ramps, pressure, etc.) are of crucial importance here.
Even though this first version of the cell does not yet have an active temperature control, it covers main applications for the pharmaceutical research and scale- up. The Slurry Flow Cell system was constructed with expert advice from Malvern Instruments (UK) and uses several proven elements from Malvern particle size instruments to prevent influencing particle morphology.
• Crystallization from supersaturated solutions: investigation of intermediates (polymorphs) and hemi-hydrates (which may differ from the final product) during the crystallization process
• Solvent / antisolvent reactions (e.g. in cleaning processes)
• Parameter variation in the crystallization process (pH, (anti-) solvent concentration, etc. )
• Small-angle X-ray scattering (SAXS) studies of early crystallization stages or nanoparticles
• Scale-up investigation
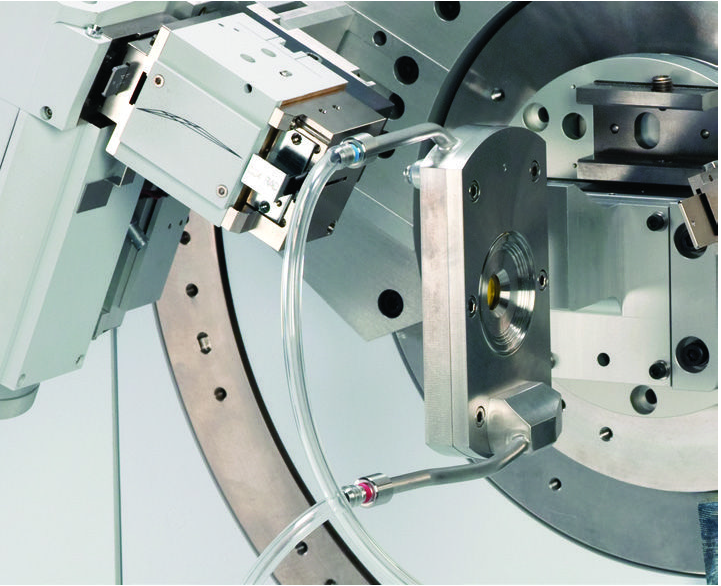
PreFIX Slurry Flow Cell mounted on an Empyrean diffractometer
For the crystallization studies we used a Slurry Flow Cell connected to a Malvern dispersion unit (Hydro 2000SM). The dispersion unit was set to 1500 – 2000 rpm to pump the slurry through the measurement flow cell. The cell was integrated on a Malvern Panalytical Theta-Theta diffractometer system, positioned in a transmission geometry mode. The system was configured with an incident beam focusing mirror, using Cu Kα radiation and the PIXcel detector on the diffracted beam side. Soller slits (0.04 rad) were used in both the incident and diffracted beam paths to limit the axial divergence of the beam.
| Instrument | Empyrean or X’Pert PRO MPD |
| Incident beam optics | Focusing mirror with incident beam anti-scatter slit, 0.04 rad Soller slits |
| Sample stage | PreFiX Slurry Flow Cell |
| Diffracted beam optics | Anti-scatter slits, 0.04 rad Soller slits |
| Detector | PIXcel3D used in 1D mode, alternatively X’Celerator detector can be used |
| Scan parameters | 13 – 32° 2θ, 0.013° step size |
| Scan time | Repetitive scans of 20 minutes |

Beam path of the used configuration
Sensitivity determination
As a test to illustrate the sensitivity of the Slurry Flow Cell, small quantities of crystalline lactose were added to ethanol (0.5 and 1 wt %). The 0.5 wt % lactose could easily be determined in this experiment after scanning for approx. 16 minutes in a 2theta range from 12 to 18 degrees (see Figure 1).
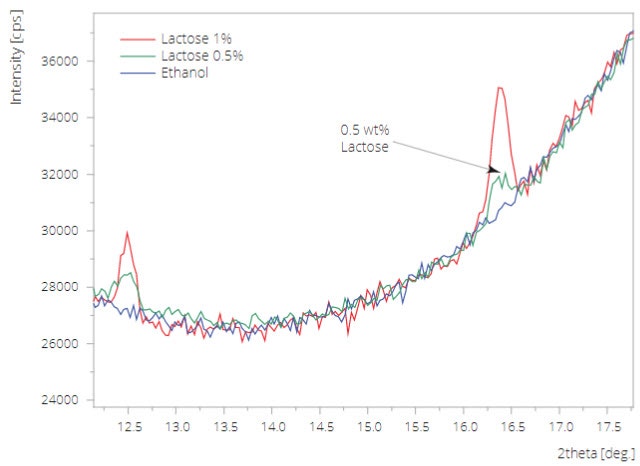
Figure 1. Sensitivity test of the Slurry Flow Cell. A quantity of 0.5 wt% lactose in ethanol (emulsion) can easily be detected
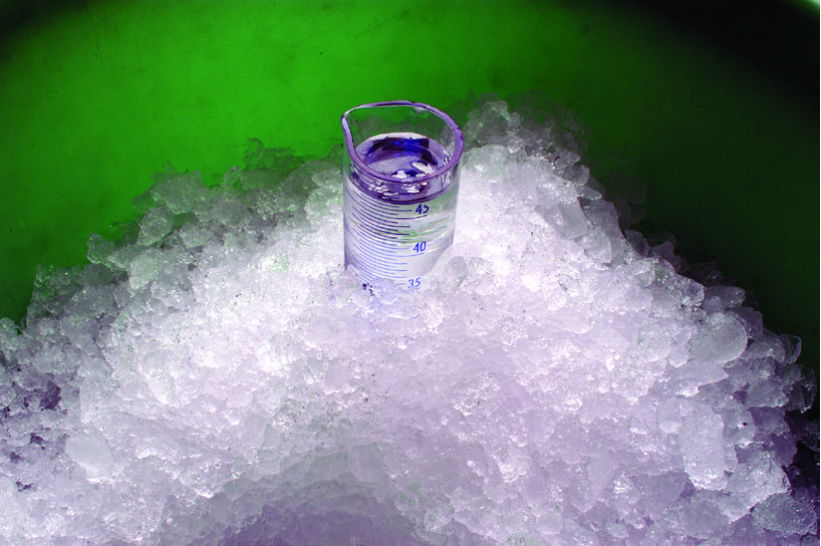
Crystallization by cooling a supersaturated solution
A small amount of DL-alanine, an amino acid with only one known (orthorhombic) crystal form, was dissolved in H2O at 65°C to get a nearly saturated alanine solution (24.5 g DL-alanine per 100 ml water), which was allowed to cool slowly towards ambient condition, while maintaining a continuous flow through the Slurry Flow Cell, Figure 2. The crystallization process was monitored by making repetitive scans in the 2theta range 13-32 degrees (scan time 20 min).
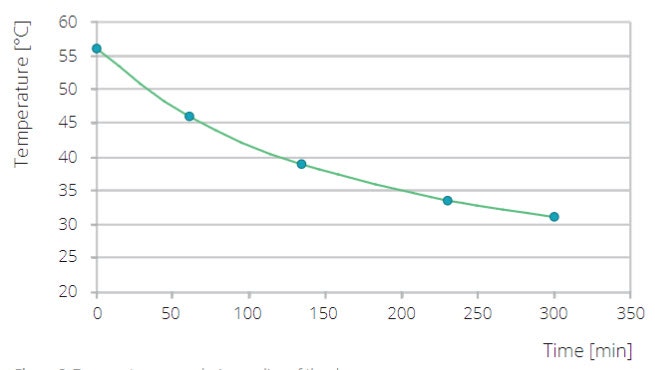
Figure 2. Temperature curve during cooling of the slurry
The different crystallization conditions show distinct differences in crystallization initiation and crystal morphology.
Crystallization in the pH 6 solution starts after more than 10 h - (Figure 3), whereas at a pH of 9.5 first crystals are formed much faster (only 4 h) (Figure 4). At a pH of 3.5 the crystallization process is very slow. Crystallites are observed after more than 30 h - (Figure 5). DL-alanine is known to grow in a needle-like crystal morphology, with its main growth direction along the c axis. In our experiments at a pH of 6.11 and at a pH of 9.5, first crystallization is most pronounced in crystal directions characterized by the appearance of the (002)- and (311)-reflection, only much later followed by fast increase of the (210)-reflection. Peaks become sharper and higher in intensity in the course of the crystallization, indicating increasingly larger crystals (Figure 6). In the very slow crystallizing condition at a pH of 3.5, the crystal morphology is less pronounced, while the broad peaks point towards smaller crystallites (Figure 5).
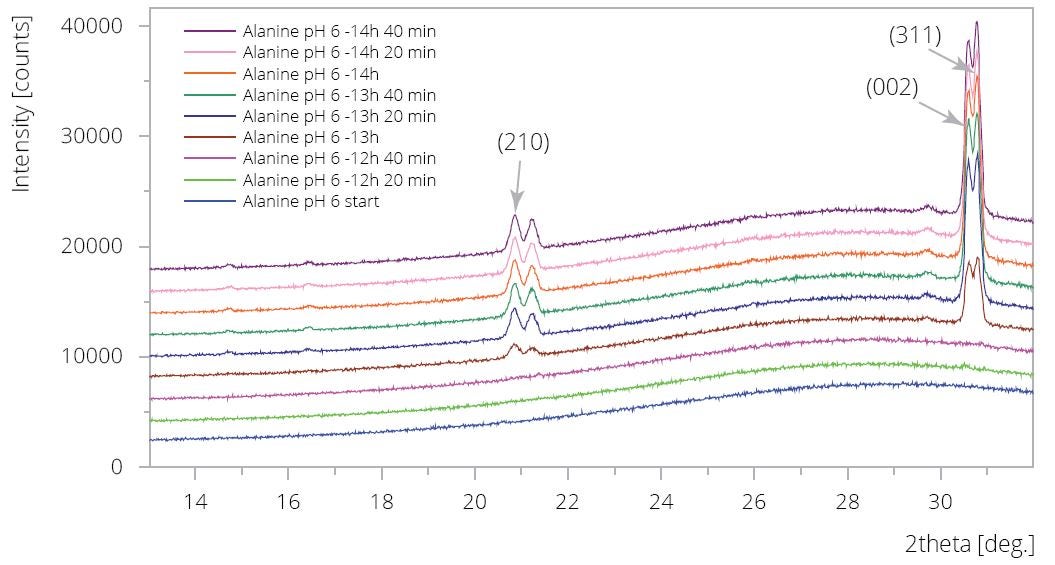
Figure 3. DL-alanine crystallization at a pH of 6. The crystallization is starting about 13 hours after initiation of the cooling process, indicated by the appearance of the (311) and (002) reflections.
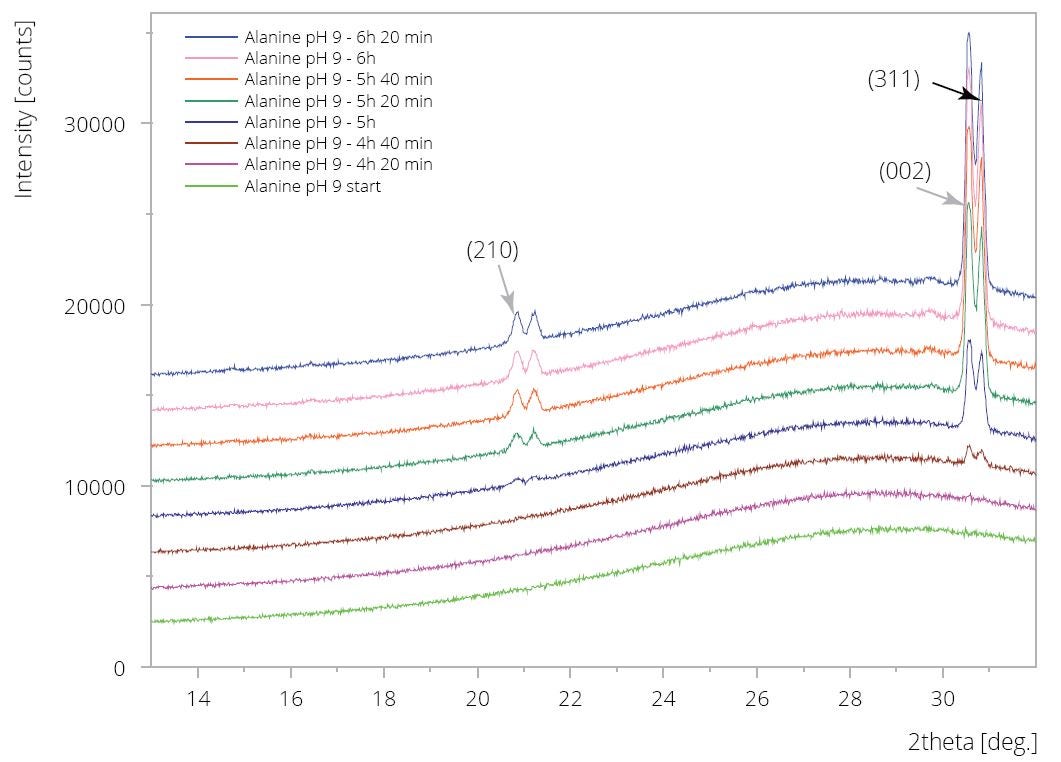
Figure 4. DL-alanine crystallization at a pH of 9.5: crystallization occurs after 4.5 hrs
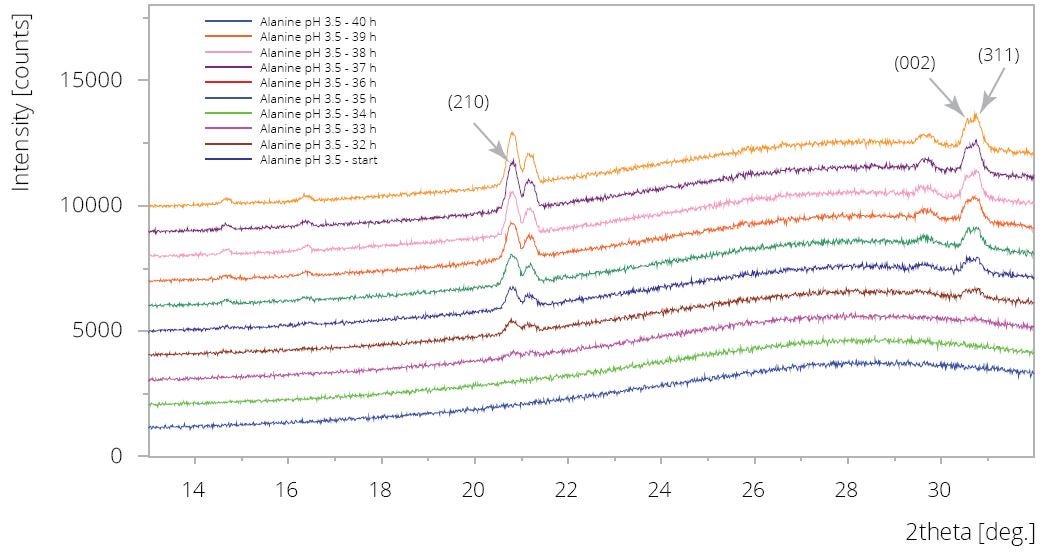
Figure 5. DL-alanine crystallization at a pH of 3.5: crystallization occurs after approx 33 hours with only very slow growth
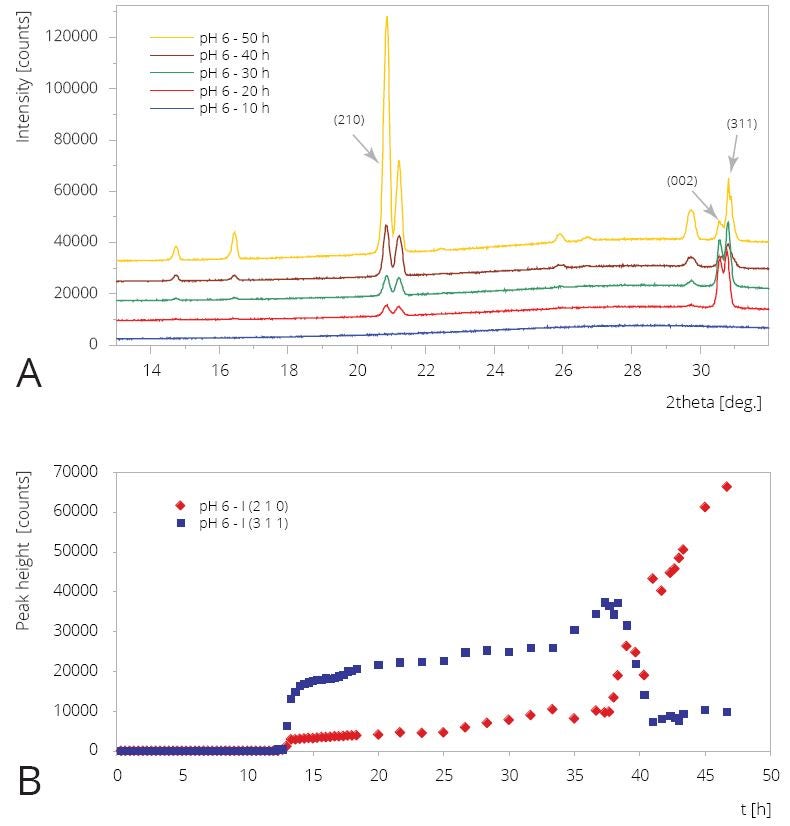
Figure 6. DL-alanine crystallization at a pH of 6. After a starting crystal growth with pronounced peaks at the (311) and (002) reflections, the (210) reflection starts to grow stronger after 38 hours.
A) Diffraction patterns during the crystallization process at a pH of 6.
B) Evaluation of peak heights of the (311) and (210) reflections during the crystallization process.
Small-angle X-ray scattering (SAXS) allows to determine particle size distributions of nanoparticles in powder materials, nanocomposites or dispersions. Figure 7 shows SAXS measurements on low concentrations of silica nano-particles with a radius of R50 = 15 nm (Ludox® TM-50 Silica) dispersed in water. For these measurements the incident beam optics have been adapted with SAXS slits. The particles have been measured in the flow cell with different concentrations. A concentration of 0.1 % silica particles in water could still easily be detected. The evaluation of the measured particle sizes with the software package EasySAXS confirms the particle radius of 15 nm for all concentrations measured.
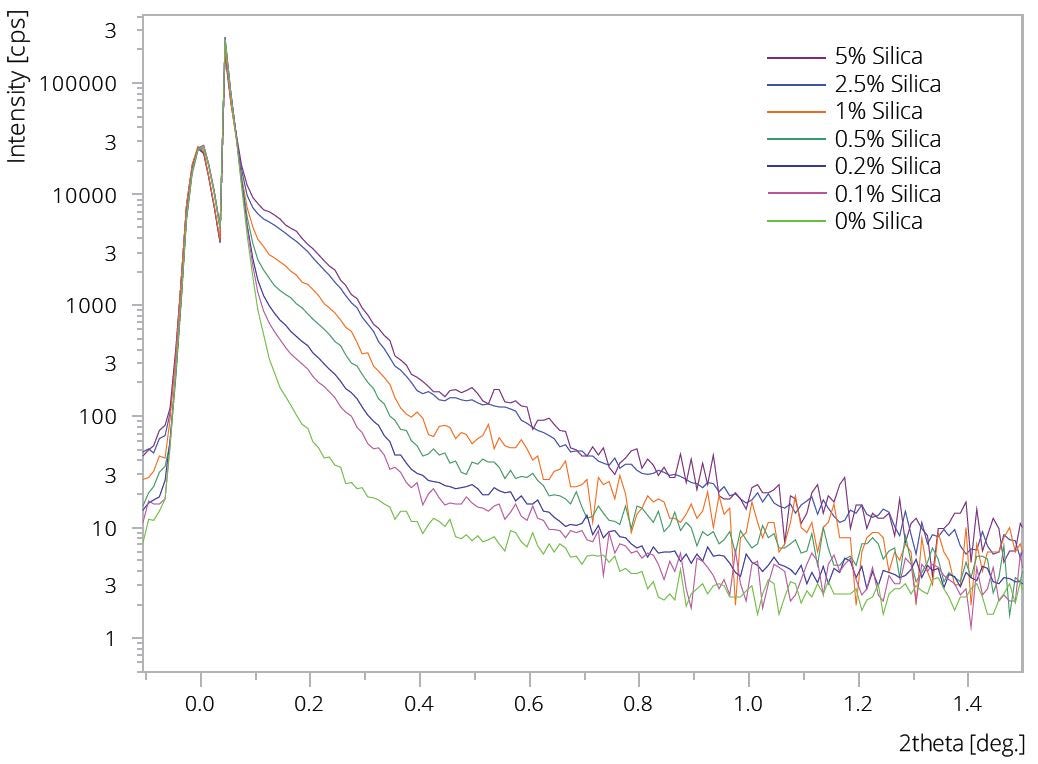
Figure 7. Normalized SAXS measurement on Ludox® TM-50 Silica nano particles with a radius of 15 nm in the flow cell. The particles were dispersed in water and were measured floating through the cell.
We have shown that the demonstrated experimental setup can be used to monitor and analyze crystallization processes from the very first stages up to high crystallite concentrations. XRD proved to be an ideal QbD technique for the investigation of the parameters influencing the different stages of the crystallization.