
A PANalytical Theta-Theta diffractometer system equipped with a focussing X-ray mirror, spinner sample stage and a fast linear solid state detector was used for time-resolved transmission measurements of hydrating Portland cements.
X-ray diffraction is one of the most important analytical tools for the investigation of cements and clinkers and their hydration products. Powder diffraction provides essential information about the phase composition of cements and Rietveld refinements enable quantitative analysis.
X-ray diffraction is one of the most important analytical tools for the investigation of cements and clinkers and their hydration products. Powder diffraction provides essential information about the phase composition of cements and Rietveld refinements enable quantitative analysis.
A new important field of investigation s in situ X-ray diffraction of hydrating cement pastes. Here the aim is to analyze hydration kinetics and observe phase transitions during the setting and hardening process of cementitious systems. X-ray analysis can be applied from the beginning of the reaction (within a few seconds of mixing the cement with water) through to reaction times of several days. Consequently, an XRD system for in situ investigations must meet a variety of different needs. The most important being: rapid sample preparation, high data quality and very high detection speed.
The Malvern Panalytical transmission X-ray geometry fulfills all these requirements and offers a new approach for time- resolved in situ measurements of both kinetic systems and standard powder samples. Advantages and disadvantages of the new setup applied to hydrating cement pastes are discussed, especially in comparison with conventional reflection systems.
The four main clinker phases of ordinary Portland cements (OPCs) are alite (3CaO•SiO2, abbreviation C3S), belite (2CaO•SiO2, C2S), aluminate (3CaO•Al2O3, C3A) and ferrite (4CaO•Al2O3•Fe2O3, C4AF). Each of the four phases shows ionic substitutions with different elements, and also polymorphism. Additional minor phases in OPC clinkers are free lime (CaO), periclase (MgO) and potentially several sulfates, eg arcanite (K2SO4). In general it is necessary to add sulfate- containing compounds such as gypsum (CaSO4•2H2O) or anhydrite (CaSO4) to avoid fast and uncontrolled setting. Normally, ettringite (C3A•3CaSO4•32H2O) is the first temporary hydration product of OPCs. After just 30 seconds, evidence of the first ettringite crystals can be seen using Cryo-Transfer Scanning electron microscopy. The early hydration process (up to around 3 h reaction time) is dominated by the strong formation of these short prismatic, hexagonal crystals. Compounds such as monosulfate (C3A•CaSO4•12…14H2O) and semicarbonate (C3A•½Ca(OH)2•½CaCO3•11.5H2O) may also be formed in lower quantities. The silica-based reaction begins after 2 to 4 h hydration. Portlandite (Ca(OH)2) and calcium silicate hydrate (C-S-H-phases, 2CaO•SiO2•1…3H2O) are the products of this reaction. Because of the small crystal sizes, or the semi-crystalline or amorphous character of C-S-H, these can be difficult to detect with X-ray analysis. As a result, the presence of portlandite is used to indicate C-S-H formation.
Carbonation is a process that takes place on cement paste and cement stone surfaces in contact with CO2. There is sufficient CO2 in air to induce this reaction. Phases such as monocarbonate (C3A•CaCO3•11H2O) or calcium carbonate (CaCO3) are formed. It is necessary to suppress these surface carbonation effects when making kinetic measurements in order to obtain realistic bulk material results. In every case, in situ measurement of cement paste requires encapsulation of the hydrating sample. This entails using specialized sample chambers for XRD systems that guarantee high humidity and the exclusion of CO2; or sample holders that allow water- and air proof preparation.
Samples and preparation
All samples were CEM I 52.5 R Portland cements. Water and cements were mixed in ratios of 0.35 to 1.0 (w/c). The transmission sample holder enabled perfect slurry film preparation of cement pastes between two pieces of transparent foils which were stretched from two plastic rings.
Preliminary tests showed that w/c ratios of 0.4 to 0.6, and defined cement paste initial weights of 0.1 to 0.3 g, deliver adequate and consistent results. W/c 0.5 and an initial weight of 0.15 g were taken as baseline conditions for the experiments.
Further experiments were performed by putting the samples in glass capillaries with diameters of 0.1, 0.3 and 0.7 mm mounted on the capillary spinner stage. The results obtained with 0.1 and 0.3 mm capillaries were also usable, but did not achieve the high data quality and ease of use of the sample preparation between the two foils.
All tests were conducted at room temperature from 22 °C to 25 °C.
Figure 1: Cryo-SEM image of OPC after 3 h hydration, showing clinker grains covered with ettringite crystals and the first C-S-H phases
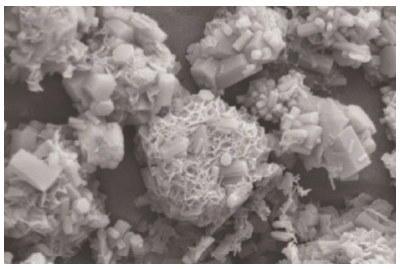
Figure 2 illustrates two important advantages of the transmission geometry compared with conventional Bragg-Brentano, addressing the facts that:
Type A and Type B foils showed minimized foil peaks in transmission mode compared with reflection mode. In addition, the transmission geometry enabled measurements to be made starting from 2° - 3° 2θ-angles.
Further problems encountered in conventional reflection geometry are the height shift of reacting samples and the preferred orientation, especially of lamellar crystals at foil contact zones.
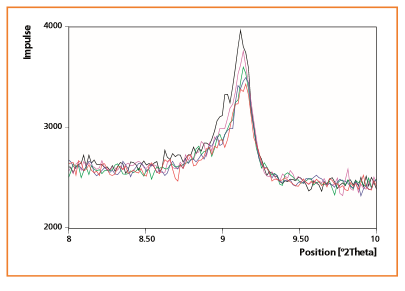
It is very difficult to prepare cement paste samples that exhibit no height movement during measurement times ranging from a few minutes to a few days hydration; and a varying sample height will result in peak shifts during the measurement. Using transmission geometry there was no peak shifting and orientation effects were drastically reduced (Fig. 3, 4, 5 and 6).
The kinetic measurement of a CEM I 52.5 R Portland cement allowed a time-resolved investigation of the phase transitions. Figures 4 and 5 show the formation of hydration products ettringite and portlandite, and the dissolution of gypsum. Ettringite exhibited constantly increasing signal intensities from 30 min hydration time to a maximum intensity at 7 h. From 7 to 10 h decreasing intensities were seen. The gypsum 021 peak at about 20.7° 2θ decreased from 1 h 30 min onwards until dissolution was complete at around 5 h reaction time. Portlandite appeared at 3 h, building continuously to around 7 h then at a lower rate to 10 h. The formation of portlandite indicated the development of the first C-S-H phases and correlated very well with Cryo-SEM results.
The combination of transmission spinner geometry and X’Celerator detector enabled rapid sample preparation and the achievement of fast scan speeds.
Figure 6 shows early ettringite formation. After only 1 min hydration the ettringite 100 peak was clearly detectable. This measurement provided evidence for spontaneous ettringite formation upon mixing cement and water. Signal intensities increased up to 3 h reaction time.
Figure 2: Comparison of different foils for XRD preparation in transmission and reflection modes. Kapton foil at transmission setup (red) and reflection setup (magenta), Mylar type A foil in transmission setup (dark blue), and in reflection setup (light blue), Mylar type B foil in reflection setup (green). Reflection measurements with zero background (Si single crystal) sample holder.
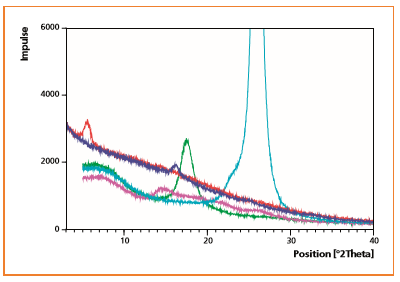
Figure 3: Comparison of kinetic measurements of OPC in transmission and reflection setups. Measurements in transmission setup with Kapton foil after 30 min (red) and 10 h (magenta) hydration time; scan parameters A. Measurements in reflection setup with Mylar type A foil after 30 min (dark blue) and 10 h (light blue) hydration time
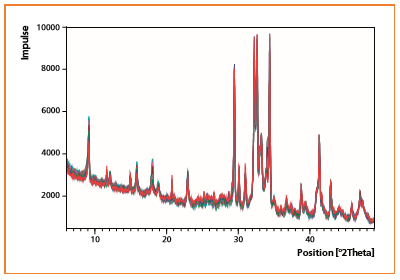
Figure 4: Kinetic measurement of OPC from 30 min to 10 h hydration time; showing the ettringite 100 100% peak at 9.091 2θ (PDF 041- 1451). Scan parameters A
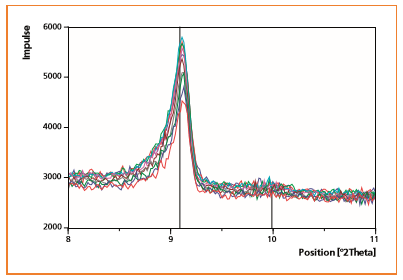
Figure 5: Kinetic measurement of OPC from 30 min to 10 h hydration time; showing the portlandite 001 72% peak at 18.008 2θ (PDF 044-1481) and the gypsum 021 100% peak at 20.722 2θ (PDF 033-0311). Scan parameters A
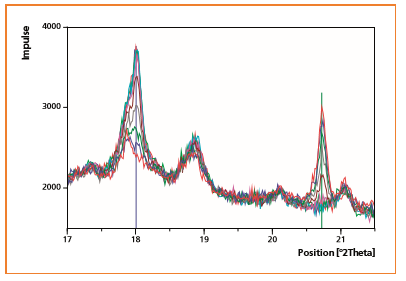
Figure 6: Kinetic measurement of OPC from 1 min to 3 h hydration time (1 min red, 4 min blue, 7 min green, 1 h magenta, 3 h black); showing the ettringite 100 100% peak at 9.091 2θ (PDF 041-1451). Scan parameters B
The X-ray diffraction geometry with focussing mirror, spinner sample stage in transmission geometry and PIXcel detector offers a number of advantages for in situ measurement of cement kinetics compared with Bragg-Brentano geometries. These include: the absence of peak shifting during measurement; the ability to measure at small 2θ angles down to 2°; very low interfering X-ray foil peaks; and a drastically reduced preferred orientation for several phases. Sample preparation was just as easy as with the air sensitive sample holder for reflection mode.
One possible drawback is the reduced sample size, which might result in more rapid drying of the cement over longer hydration times. For more extended experiments (up to a few days) attention must be paid to the preparation technique in order to prevent an untimely drying of the hydrating samples.
This novel X-ray diffraction geometry opens up new approaches to kinetic investigations of cementitious systems. In doing so, it extends the potential application of in situ X-ray analysis in this area.