X-ray fluorescence analysis is a nondestructive, straightforward and fast approach to carry out quality control checks on ceramics. However, the size of ceramic inclusions typically requires analysis of a much smaller spot size compared to traditional bulk XRF techniques. This study illustrates the capability of Zetium to perform small spot analysis and elemental distribution mapping of an inclusion in a ceramic.
Ceramics comprise a wide range of materials and are used in a wide range of applications. These include high-performance industrial tools (such as ball bearings and cutting tools), structural products (such as bricks, tiles, roof tiles) and household items (such as art decors and sanitary ware). Quality control of ceramics has become an important challenge to manufacturers. A slight sample contamination or impurity can heavily influence the chemical and physical properties of the ceramic and can potentially have harmful effects on the user. This can lead to rejects during the production process, which results in a revenue loss for the manufacturer.
Quality control of ceramics has become an important challenge to manufacturers. A slight sample contamination or impurity can heavily influence the chemical and physical properties of the ceramic and can potentially have harmful effects on the user. This can lead to rejects during the production process, which results in a revenue loss for the manufacturer. X-ray fluorescence (XRF) analysis is a nondestructive, straightforward and fast approach to carry out quality control checks on ceramics. However, the size of ceramic inclusions typically requires analysis of a much smaller spot size compared to traditional bulk XRF techniques. This study illustrates the capability of Zetium to perform small spot analysis and elemental distribution mapping of an inclusion in a ceramic.
The measurements were performed using a Zetium XRF spectrometer equipped with a 4 kW, Rh-anode SST R-mAX tube, a high-performance ED core, and state-of-the-art SuperQ software. The ceramic sample was mounted in a special small spot sample holder and imaged using a high- resolution camera. A 4.75 x 5.75 mm measurement area was defined in the instrument's SuperQ software based on the captured image. The measurement spot size used was 500 µm with a step size of 250 µm resulting in a total of 437 measurement spots. Sample translation was made possible using high-precision turret mechanics for positioning between different spots. The total measurement time needed to map the sample was about 14 hours.
Qualitative intensity analysis was performed to provide elemental distribution over an area of the sample containing the inclusion. Figure 1 shows the ceramic sample and the heterogeneous sample area used for the measurement (in the rectangle). Table 1 shows the measurement conditions used in the analysis of the sample.
Figure 1. Sample image showing the area for the mapping measurements. The ceramic dimension is 1.4 cm x 1.5 cm x 0.6 cm (L x W x H).

Table 1. Conditions for the qualitative analysis

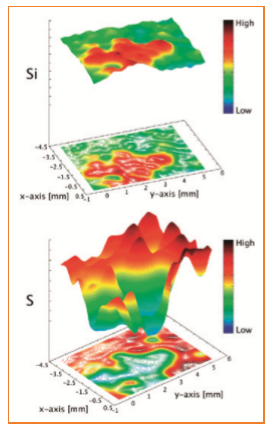
Figure 2 shows the 2D intensity mapping of the 12 elements found in the sample. The results can also be represented in 3D contour maps as shown for Si and S in Figure 3.
A total of 12 elements were simultaneously identified with just a short measurement time of 100 seconds per spot without the need for calibration setup. Results revealed that the elemental distribution of the inclusion is clearly different from the rest of the sample, especially for elements such as Si, S, and Zn. In particular, results show a significant increase in Si intensity in the inclusion area of the sample with a corresponding decrease in S intensity. The heterogeneity of the inclusion may suggest possible abnormalities during the production process such as incomplete melting of the Si phase during manufacture.
Figure 2. 2D intensity mapping for 12 elements identified in the ceramic inclusion and surrounding area

Figure 3. 3D intensity contour maps for Si and S.
This study shows the potential impact of performing practical elemental mapping in the production of ceramics, where results can contribute to the improvement of the manufacturing processes. This was achieved in a relatively short period of time, with minimum effort and without calibration setup. It also shows that the Zetium spectrometer equipped with an ED core and small spot mapping functionality is an excellent solution for the production of ceramics in addition to normal bulk XRF analysis.