The continuous casting of slabs is aimed to produce a product with a certain chemical composition, geometry and surface quality, without any or a minimum acceptable level of external and internal defects. One of the most unpredictable defects of the slabs is centerline segregation, which has undesired effects on further processing of the slabs and hence on the possible uses of the final product.
This application note demonstrates the capability of practical, fast elemental distribution mapping of two steel samples showing chemical segregation, analyzed for quality control purposes.
The continuous casting of slabs is aimed to produce a product with a certain chemical composition, geometry and surface quality, without any or a minimum acceptable level of external and internal defects. One of the most unpredictable defects of the slabs is centerline segregation, which has undesired effects on further processing of the slabs and hence on the possible uses of the final product.
Segregation can occur at two different scales: micro-segregation, leading to variations in composition in the micrometer range and macro- segregation, involving chemical variations over the length of the slab (Figure 1 and Figure 2). Micro- segregation can be removed by homogenization heat treatments, but it is practically impossible to remove macro-segregations. It is of critical importance to identify macro- segregation to be able to predict its effect on physical and chemical properties.
X-ray fluorescence systems equipped for small spot analysis and elemental distribution mapping can be employed to effectively control segregation during the production process. This application note demonstrates the capability of practical, fast elemental distribution mapping of two steel samples showing chemical segregation, analyzed for quality control purposes.
Figure 1. Variations in Cr, Mo and Ni concentrations between bulk slab and segregated zones occurred at casting
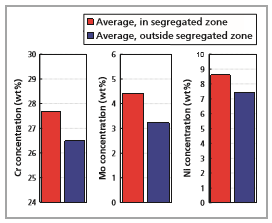
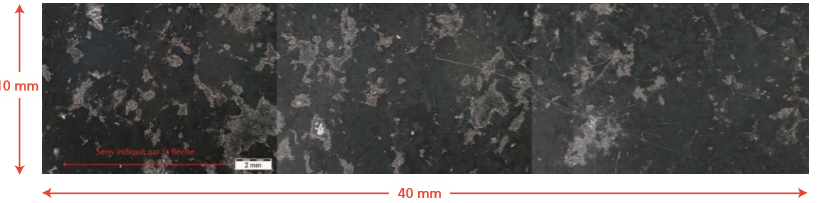
Figure 2. Scanning electron microscopy (SEM) micrograph, highlighting the surface of a slab sample after etching. White regions indicate segregation of Cr, Ni and Mo from the bulk.
Measurements were performed using a Zetium XRF spectrometer configured with a 4 kW Rh-anode SST R-mAX X-ray tube and the WD core for WDXRF analysis. To enable the spot analysis and mapping capability, the spectrometer was equipped with an ED core, high-precision translation mechanics for sample positioning and a high-resolution camera for sample imaging. Using the ED core offers the advantage of performing simultaneous analysis for all elements present, whereas using the WD core would imply already knowing which elements are present and repeating each spot analysis for the number of elements needed to be mapped. All measurements were conducted using the state-of-the-art SuperQ software package.
Two steel samples named Brame 1 and Brame 2 are the object of this study (Figure 3). Samples were placed into a special mapping sample holder and imaged using a high-resolution camera. The samples were then loaded into the measurement position using a special turret mechanism and analyzed using SuperQ software.
In order to map the elemental distribution of a small area, a conventional calibration on a small spot was set up using 11 standards, including six NiFeCo setup samples and two standards from the ECRM series (298/1 and 289-1). The two samples were measured against the calibration using a step size of 250 microns and respectively analyzed in 1269 spots for sample Brame 1 and 1932 spots for sample Brame 2.
Figure 3. a) Sample Brame 1 analyzed for a 6.5 mm x 11.5 mm mapped area; b) sample Brame 2 analyzed for 10 mm x 11 mm mapped area
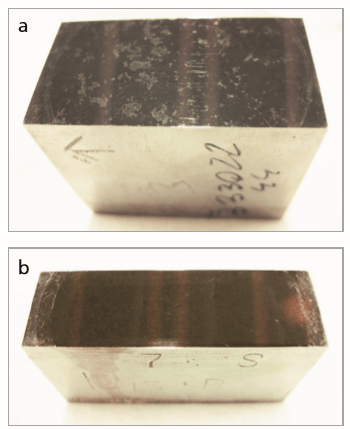
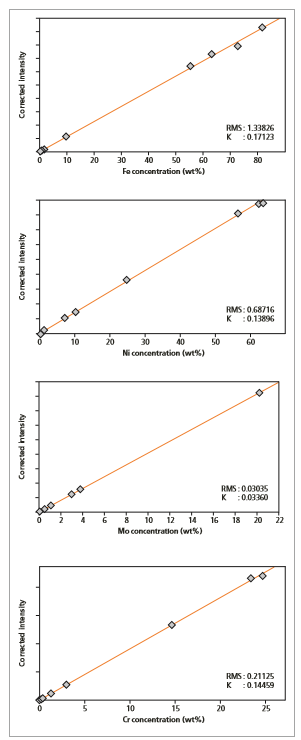
Figure 4 shows calibration lines for Fe, Ni, Cr and Mo with RMS and K values as a result of a NiFeCo calibration performed on small spot mapping (0.5 mm).
Figure 4. Calibration lines on 0.5 mm spot size for Fe, Ni, Mo and Cr
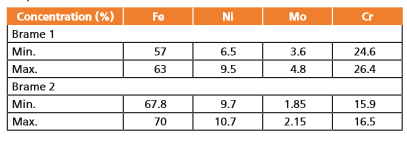
Compositional images (Figure 5) show the variations in elemental distribution for the two samples in the mapped areas, clearly more evident for sample Brame 1. Compositional variations measured for the mapped areas of both samples are reported in Table 1.
The elemental distribution mapping can help to identify and localize the chemical segregation, which can ultimately alter chemical and physical properties of the final product and therefore cause failure to meet product specifications.
Figure 5. 2D contour plots for Fe, Ni, Mo and Cr in samples Brame 1(a) and Brame 2 (b) presenting and macro-segregation and a high-resolution image of the area mapped
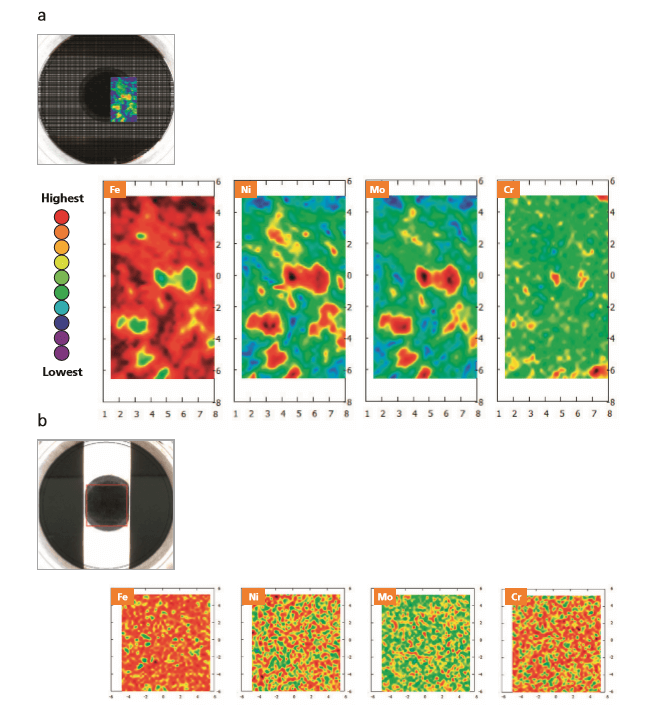
Table 1. Variation in elemental concentration in the mapped areas for samples Brame 1 and Brame 2.
The results clearly demonstrate that the integration of EDXRF (equipped to perform small spot analysis and mapping) in the Zetium spectrometer delivers fast and accurate analysis of a steel sample which experienced macro- segregation during casting. This analysis performed as routine test may be helpful to improve process control.
The possibility to perform small spot analysis and mapping using the ED core enables fast simultaneous analysis of all elements present without compromising the analytical performance of the WDXRF optics. Furthermore it is considerably faster than using a conventional WDXRF, where each element present needs to be measured sequentially. The inclusion of the ED core has other advantages, such as fast sample screening, with or without Omnian, and identification and flagging of unexpected elements in process control.