In this data sheet we show a typical example of the fast and precise analysis of mineralogical ore compositions with Aeris.
The exploitation of new iron ore deposits of lower ore grade requires accurate and frequent monitoring of the mined material during mine planning and ore beneficiation. The presence of minerals such as clays, carbonates or silicates influence the properties and the grade of an iron ore.
Resolving the mineralogical composition of the mined material by X-ray diffraction (XRD) is essential for optimizing operational efficiency of the mining and the beneficiation process of iron ore.
Knowing the qualitative and quantitative mineral composition of iron ore gives additional information for efficient downstream processing. Using a benchtop diffractometer in a laboratory or an automation helps to achieve optimal efficiency during mining and beneficiation.
The exploitation of new iron ore deposits of lower ore grade requires accurate and frequent monitoring of the mined material during mine planning and ore beneficiation. The presence of minerals such as clays, carbonates or silicates influence the properties and the grade of an iron ore. Resolving the mineralogical composition of the mined material by X-ray diffraction (XRD) is essential for optimizing operational efficiency of the mining and the beneficiation process of iron ore. The Minerals edition of Aeris is the first benchtop X-ray diffractometer designed for process control and geometallurgical characterization in the mining industry. In this data sheet we show a typical example of the fast and precise analysis of mineralogical ore compositions with Aeris.
In order to demonstrate the flexibility and determination limits of the Minerals edition of Aeris, samples from two iron ore deposits with different mineralogy were analyzed. The presented data were measured using cobalt radiation, which is especially suited for geological materials with higher iron contents, as it produces high-resolution data without creating excessive sample fluorescence.
The measurement time for each sample was less than 11minutes followed by automated data evaluation using standardless full-pattern Rietveld quantification [1] to determine the quantitative mineral composition of the samples. In addition to the crystalline phases, the amorphous content was determined using the external standard approach, [2]. α-Al2O3 (>99.9% pure) was used as external standard.
Figure 1 illustrates an example for a full-pattern Rietveld quantification of a lateritic iron ore sample. Main ore minerals are goethite (FeOOH) and hematite (Fe2O3). Minor phases present are magnetite (Fe3O4), rutile (TiO2), anatase (TiO2), clay minerals, carbonates, quartz (SiO2) and anamorphous fraction. The comparison of seven lateritic iron ore samples shows variations in the iron-containing minerals, the impurities and the amorphous content. A correlation between the goethite and the amorphous phase is visible.
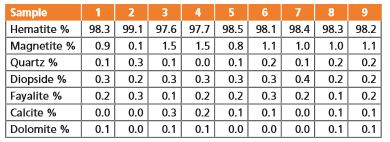
The results of the analysis of the samples from a banded iron formation is shown in Figure 2. More than 97% of all samples is hematite. Impurities of magnetite, silicates and carbonates could be detected and analyzed. The detection limits for the minor minerals such as magnetite in the banded iron ores depend on the measurement time per sample. For the presented 10 minutes measurements on an Aeris Minerals edition diffractometer, detection limits of0.1-0.2% for all minerals present were found.
Knowledge of the mineralogical composition of iron ore samples also allows the calculation of the Fe2+/Fe3+ ratio from the known stoichiometry of the minerals. Other statistical tools such as cluster analysis or direct monitoring of process-relevant parameters with partial least squares regression (PLSR) can be easily applied to track iron ore grades in all stages of the mining and beneficiation process.
Figure 1. Quantitative Rietveld results of a typical lateritic Fe ore mainly consisting of goethite and hematite with the presence of minor amounts of quartz and an amorphous content of >10 wt.%
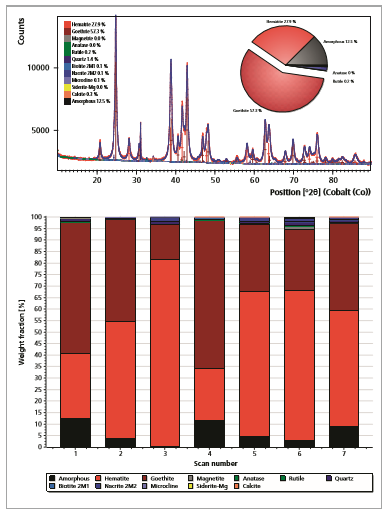
Figure 2. Quantitative Rietveld results of a typical banded Fe ore mainly consisting of hematite and magnetite with the presence of minor amounts of silicates and carbonates
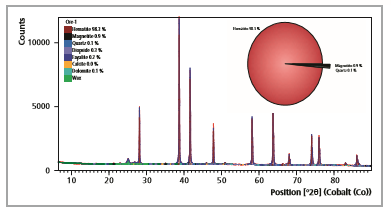
Table 1. Quantitative results of 9 ores from a banded iron formation
Rapid mineralogical analysis with the Minerals edition of Aeris offers a reliable method to determine crystalline and amorphous phases of iron ores. Minor minerals can be detected within minutes. Frequent monitoring enables fast counteraction to retrieve optimal beneficiation conditions.
[1] Rietveld, HM (1969): A profile refinement method for nuclear and magnetic structures. J.Appl. Crys. 2, p. 65-71.
[2] O’Connor, B.H. & Raven, M.D. (1988): Application of the Rietveld refinement procedure in assaying powdered mixtures. Powder diffraction,3, 2-6.