This application note describes the analysis of gelatin and chitosan materials that have been chemically modified with the intention of improving their properties for 3D-bioprinting applications. Using the OMNISEC multi-detection system, distinct differences between the starting materials and the crosslinked materials were identified.
3D-printing of biocompatible and biodegradable materials has the potential to revolutionize medicine through one of a kind implants, drug delivery systems and personalized medicines. The technique used to 3D print biopolymers is extrusion printing, which uses a polymer-based filament pre-heated in the printhead and deposited through a nozzle. Moving in two dimensions this technique builds the three-dimensional shape through a layer-by-layer process.
Extrusion bioprinting has been used to incorporate cells into hydrogels consisting of either synthesized or biologically derived materials. However, the variety of the materials that can be used in 3D-printing, and more specifically 3D-bioprinting, is limited. Gelatins and chitosans are attractive options for this application as they are biologically derived materials and FDA approved. Nevertheless, gelatins and chitosans lack the mechanical properties desired for the 3D printed constructs. To overcome this flaw, chemical modification such as crosslinking has been shown to not only improve the mechanical properties of these polymers for printing, but to also control the drug release profile when the 3D printed constructs are implemented as drug delivery systems.
The polymer filaments used in additive manufacturing would primarily be characterized in terms of their molecular weight and molecular weight distribution. Size exclusion chromatography (SEC) or equivalently gel permeation chromatography (GPC) is a widely used technique to characterize macromolecules, from bulk manufactured polymers to proteins. This technique can be used to measure the molecular weight moments, molecular weight distribution, the intrinsic viscosity, and hydrodynamic size of these macromolecules. The intrinsic viscosity measurements combined with the molecular weight can be used to identify structural differences between samples.
This application note describes the analysis of gelatin and chitosan materials that have been chemically modified with the intention of improving their properties for 3D-bioprinting applications. Using the OMNISEC multi-detection system, distinct differences between the starting materials and the crosslinked materials were identified.
The gelatin and chitosan materials were analyzed under aqueous conditions on an OMNISEC multi-detection GPC system. The degree of crosslinking in the materials was controlled by the amount of crosslinker added during the crosslinking reaction, the gelatins were loaded with 0.10, 0.50 and 1.00 % crosslinker, while the chitosans were loaded with 0.00, 0.15, 0.75 and 1.50 %. Figure 2 shows the multi-detector chromatogram from the analysis of the gelatin containing 0.00 % crosslinker as an example. In this figure, the refractive index detector signal is in red, the viscometer signal in blue, the right-angle light scattering (RALS) signal in green, and the low angle light scattering (LALS) in black. The calculated molecular weight at each retention volume is also shown in gold to visualize the sample’s calculated molecular weight distribution.
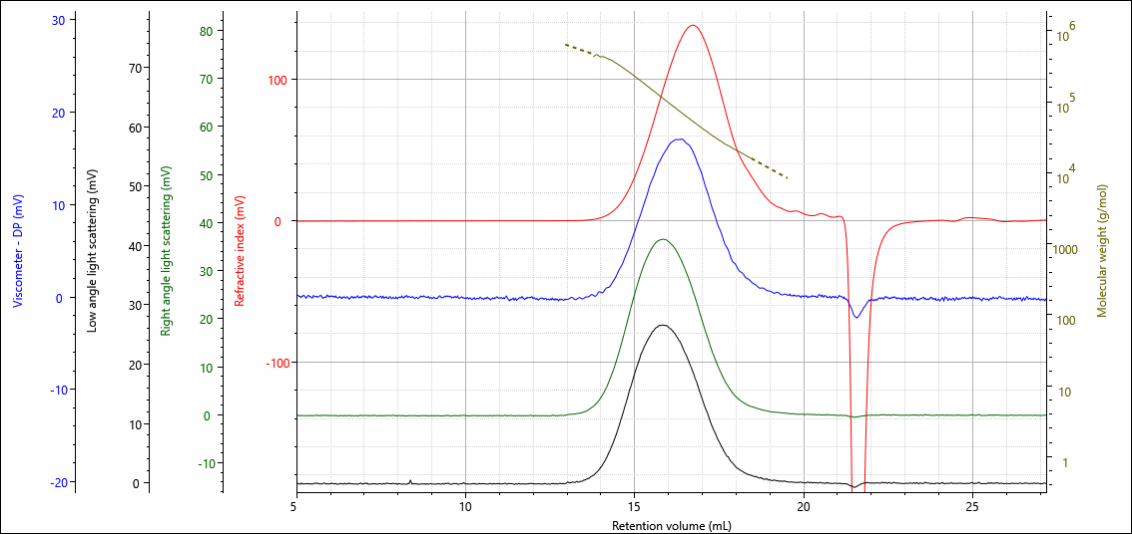
Figure 1. Multi-detection chromatogram of gelatin 0.0 % crosslinker overlaid with the calculated molecular weight
The quantitative results for the 8 samples are presented in Table 1. The absolute molecular weight is reported as weight average molecular weight (Mw) and number average molecular weight (Mn). The molar mass distribution is quantified by the dispersity (Đ), which is determined from the ratio Mw/Mn. Introducing the crosslinker to the gelatin sample resulted in the molecular weight increasing by four times its original non-crosslinked value and the molar mass distribution increasing two times its original value. The intrinsic viscosity (IV) was found to remain near 0.2 dL/g, whereas the hydrodynamic radius (Rh) was found to increase with increasing degree of crosslinking. The chitosan samples do not follow the same trends as the gelatin samples. An initial dramatic increase in Mw, Đ and Rh was observed by increasing the crosslinker % from 0.00 to 0.15. Further increases to the % crosslinker led to the samples becoming insoluble. This suggests that the chitosan crosslinking process was more efficient than the gelatins, and this may be due to the differences in reactivity of the two different sample types towards the crosslinker or the conditions in which the crosslinking was performed.
Sample type | % Crosslinker
| Mw (g/mol) | Mn (g/mol) | Đ | IV (dL/g) | Rh (nm) |
|---|---|---|---|---|---|---|
| Gelatin | 0.00
0.10 0.50 1.00 | 76,300 91,700 190,900 324,200 | 41,100 46,000 69,800 102,500 | 1.86 1.99 2.74 3.16 | 0.20 0.19 0.22 0.23 | 5.9 6.1 7.9 9.4 |
| Chitosan | 0.00 0.15 | 28,300 212,000 | 19,900 27,500 | 1.42 7.72 | 0.70 0.74 | 6.5 12.8 |
The results above are presented as average values, however, information on the size and structure are determined across the entire Mw distribution of the sample. This is represented graphically in Figure 2, as the Rh and IV are presented as a function of the sample’s increasing molecular weight.
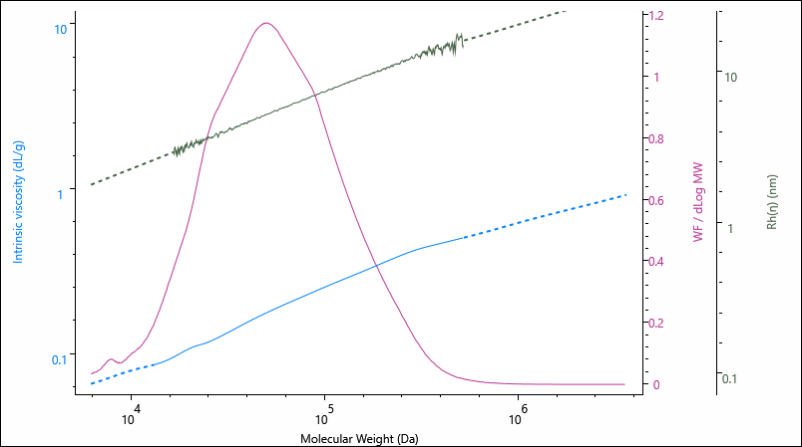
Figure 2. Overlay of molecular weight distribution, hydrodynamic size (Rh) and intrinsic viscosity (IV) for the gelatin 0.00 % crosslinker sample.
Successful crosslinking of a sample should lead to a difference in polymer structure and the Mark-Houwink plot is a useful tool for investigating these differences. A detailed application note on the use of Mark-Houwink plots can be found here.
On a Mark-Houwink plot, the intrinsic viscosities of samples can be compared across their molecular weight distributions. The lower the intrinsic viscosity of a sample the higher its molecular density is. In Figure 3 a direct correlation is observed between increasing molecular density and increasing amount of crosslinker (% crosslinker). This observation signifies the successful control over the degree of crosslinking with % crosslinker.
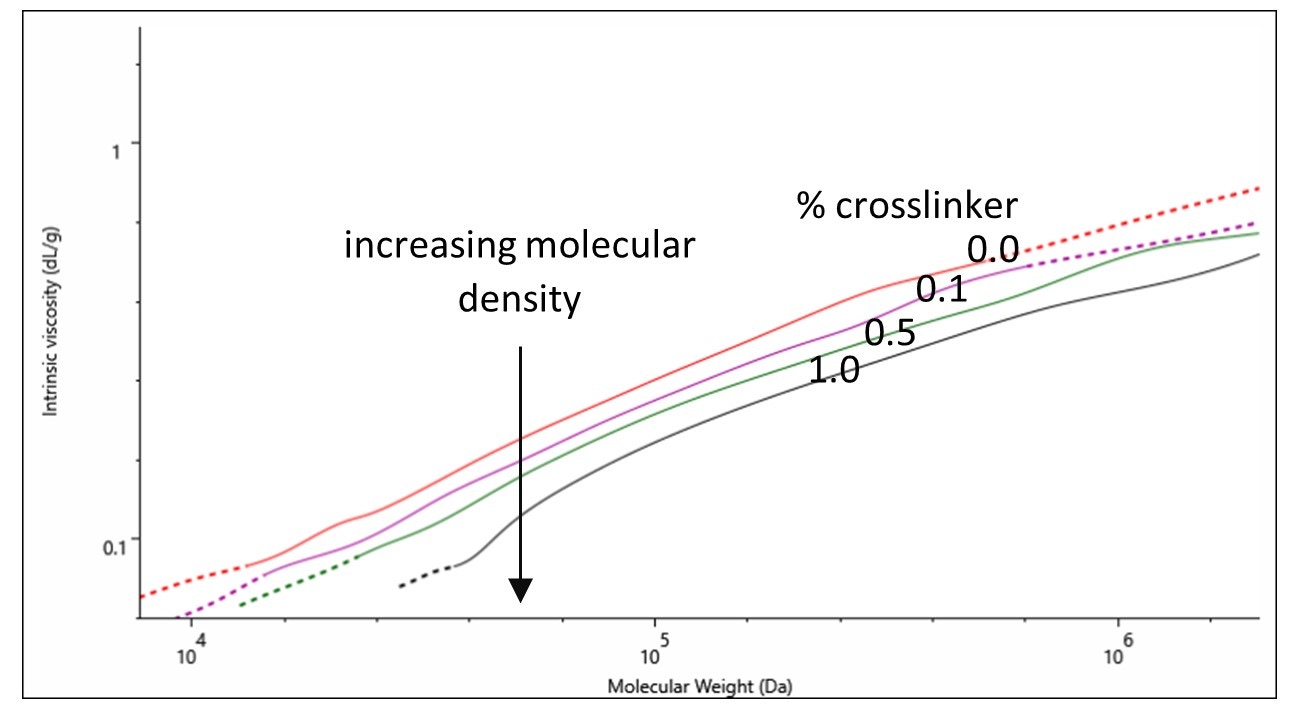
Figure 3. Mark-Houwink plot of gelatin samples containing various percentages of crosslinker: 0.0 (red), 0.1 (purple), 0.5 (green) and 1.0 % (black).
The analysis of the crosslinked gelatin and chitosan samples using multi-detection GPC provided absolute molecular weight, size and structural information on the samples. Changes in molecular weight distributions were identified with the powerful light scattering technology of the OMNISEC system. Additionally, the intrinsic viscosity values derived from the use of the in-line viscometer, combined with the absolute molecular weight values were used to produce Mark-Houwink plots. The Mark-Houwink plot of gelatins containing various % of crosslinker was used to identify structural differences between the samples providing a key insight to how the polymer changes upon the chemical modification.
Further studies upon these crosslinked gelatin and chitosan samples, which are yet to be published, showed that the chemical modification altered their drug release profile, in accordance with the Mw and structural differences discovered by using the OMNISEC system. This illustrates that the OMNISEC is an important tool in the characterization of the modified biopolymers for 3D-printing, giving a valuable contribution to the development of polymers with tailored properties for the optimization of the 3D-printing process and final application.