Catalytic inks are the key component when balancing cost, performance, and durability of proton exchange membrane fuel cells (PEMFC’s). Scaling up PEMFC production requires careful control of the ink to produce uniform electrode layers that use as little precious metal catalyst as possible. Particle size and dispersion critically impact the behavior of the ink and resulting performance of the electrode layers, affecting important parameters such as ink viscosity, ionomer distribution and morphology, catalyst utilization, interaction between the catalyst and ionomer, and the homogeneity and continuity of the electrode layer.1
Particle size is a crucial but difficult parameter to measure in catalytic inks. No single technique can provide a complete characterization because the inks contain a complex mixture of particles with different size scales. The active catalysts are Pt metal group nanoparticles with an optimal size of 2 to 5 nm. However, these nanoparticles are not independent but are rather dispersed onto carbon support particles. The carbon support particles have a primary particle size of 20 to 40 nm but are typically found in the form of larger agglomerates in the sub µm to µm size range. Ionomers, dispersed into aggregates with different shapes (rods or coils) and sizes ranging from 70 nm to 2.5 µm, are mixed with the carbon-supported catalysts to form the ink.
The catalyst and ionomer particles are dispersed in a solvent and mixed to optimize aggregate size and the contact between the ionomer and the catalyst particles. In general, smaller ionomer aggregates, from 200 to 400 nm in size, are beneficial for better H2/air performance2. The carbon-supported catalyst, however, can be under- or over-dispersed. When under-dispersed, the carbon remains highly agglomerated; the ionomer only coats the exterior of the agglomerates and the interior Pt catalyst are not accessible to protons and are therefore under-utilized. When over-dispersed, agglomerates break apart and Pt particles separate from the carbon support, which prevents them from being active in oxygen reduction reactions. The ideal dispersion produces small agglomerates of carbon-supported catalyst particles that promote uniform distribution of the ionomer on the agglomerate and better catalyst utilization.3
X-ray diffraction (XRD), laser diffraction (LD), and dynamic light scattering (DLS) are three characterization techniques with proven ability to scale-up in support of mass production.These three techniques each probe a different size regime and, when combined, can provide a comprehensive overview of the particles in the catalytic ink mixture.
Catalytic inks are the key component when balancing cost, performance, and durability of proton exchange membrane fuel cells (PEMFC’s). Scaling up PEMFC production requires careful control of the ink to produce uniform electrode layers that use as little precious metal catalyst as possible. Particle size and dispersion critically impact the behavior of the ink and resulting performance of the electrode layers, affecting important parameters such as ink viscosity, ionomer distribution and morphology, catalyst utilization, interaction between the catalyst and ionomer, and the homogeneity and continuity of the electrode layer.1
Particle size is a crucial but difficult parameter to measure in catalytic inks. No single technique can provide a complete characterization because the inks contain a complex mixture of particles with different size scales. The active catalysts are Pt metal group nanoparticles with an optimal size of 2 to 5 nm. However, these nanoparticles are not independent but are rather dispersed onto carbon support particles. The carbon support particles have a primary particle size of 20 to 40 nm but are typically found in the form of larger agglomerates in the sub µm to µm size range. Ionomers, dispersed into aggregates with different shapes (rods or coils) and sizes ranging from 70 nm to 2.5 µm, are mixed with the carbon-supported catalysts to form the ink.
The catalyst and ionomer particles are dispersed in a solvent and mixed to optimize aggregate size and the contact between the ionomer and the catalyst particles. In general, smaller ionomer aggregates, from 200 to 400 nm in size, are beneficial for better H2/air performance2. The carbon-supported catalyst, however, can be under- or over-dispersed. When under-dispersed, the carbon remains highly agglomerated; the ionomer only coats the exterior of the agglomerates and the interior Pt catalyst are not accessible to protons and are therefore under-utilized. When over-dispersed, agglomerates break apart and Pt particles separate from the carbon support, which prevents them from being active in oxygen reduction reactions. The ideal dispersion produces small agglomerates of carbon-supported catalyst particles that promote uniform distribution of the ionomer on the agglomerate and better catalyst utilization.3
X-ray diffraction (XRD)
,
laser diffraction (LD)
, and
dynamic light scattering (DLS)
are three characterization techniques with proven ability to scale-up in support of mass production.
These three techniques each probe a different size regime and, when combined, can provide a comprehensive overview of the particles in the catalytic ink mixture.
X-ray diffraction (XRD) is routinely used to determine the size of nanocrystallites less than 100 nm. A fast measurement (1 to 3 minutes) of a single diffraction peak is sufficient to quantify crystallite size using Scherrer analysis of the peak width. Alternatively, whole pattern fitting techniques can be used for more precise quantification of crystallite size and lattice parameters if multiple diffraction peaks are measured (20+ minutes).
Figure 1 shows X-ray diffraction data collected using an Aeris benchtop X-ray diffractometer to measure powders of catalytic Pt dispersed on three different carbon support particles. As tabulated in Table 1, Pt dispersed on Ketjenblack EC-300J carbon black had a slightly smaller average crystallite size than Pt dispersed on Vulcan XC72 carbon or Vulcan XC72R carbon. Changes in crystallite size can change catalytic activity and durability. Whole pattern fitting analysis also showed that the lattice parameter was larger for Pt dispersed on EC-300J than Pt on Vulcan XC72 or Vulcan XC72R. This lattice parameter is also larger than the published reference value of 3.9231 Å for Pt.4 The larger lattice parameter may suggest surface-induced lattice strain or an alloyed impurity that may alter catalytic activity.
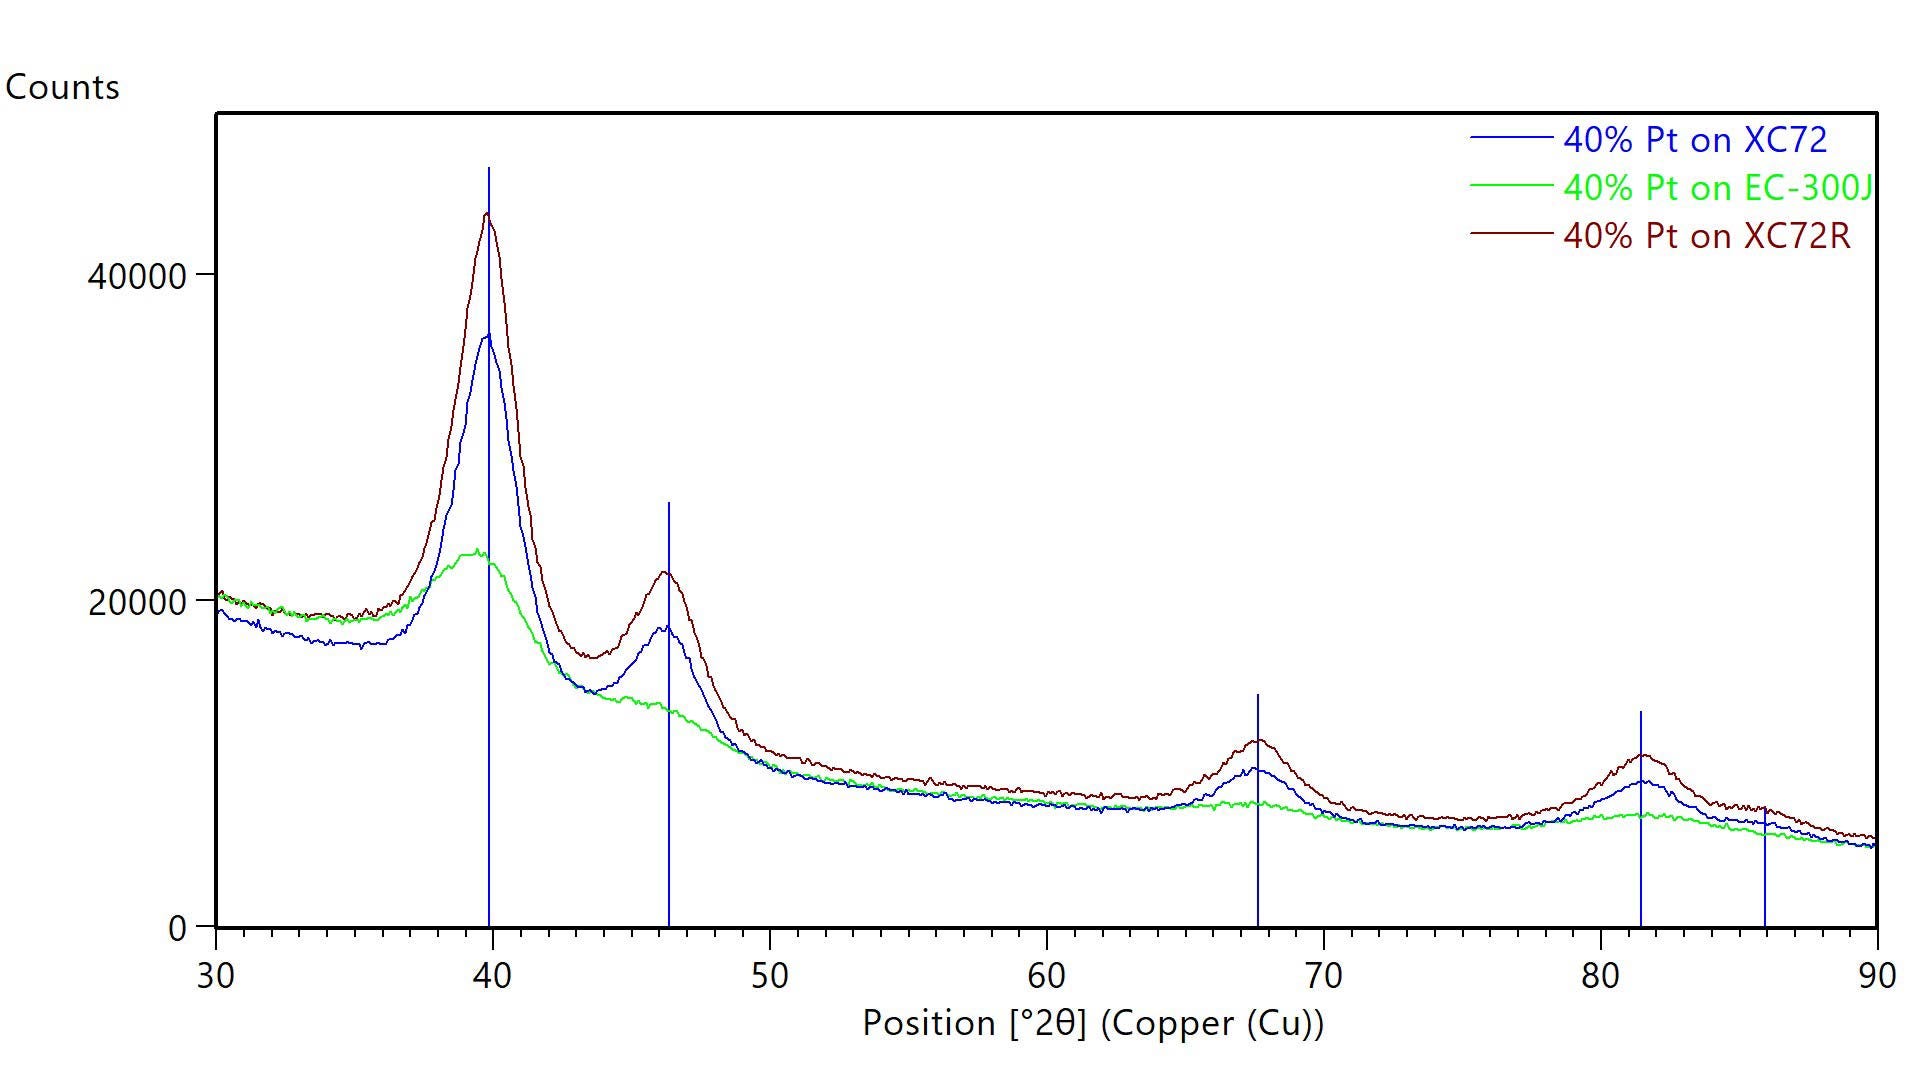
Figure 1: XRD data from carbon-supported catalyst powders. Each powder contained 40% Pt dispersed on different carbon supports: Vulcan XC72 (blue), Vulcan XC72R (maroon), and EC-300J (green). Blue lines indicated the published positions of Pt diffraction peaks.
| Single Peak (Scherrer Analysis) | Whole Pattern Fitting (Rietveld) | ||
|---|---|---|---|
| Crystallite Size (nm) | Crystallite Size (nm) | Lattice Parameter (A) | |
| 40% Pt on Vulcan XC72 | 3 | 3.2 | 3.9270 |
| 40% Pt on Vulcan XC72R | 3 | 3.1 | 3.9262 |
| 40% Pt on EC-300J | 2 | 2.4 | 3.9614 |
XRD can analyze dispersions and solid pieces as well as powders. For example, carbon-supported Pt catalyst nanoparticles can be measured after the powder is dispersed into an ink and after the ink is printed and cured on a membrane or gas diffusion layer. Figure 2 shows XRD data from 40% Pt on Vulcan XC72 carbon as a powder, in an ink, and as a cured electrode layer on a catalyst-coated membrane (CCM). In all cases, the Pt diffraction peaks were easily resolved from other components for nanocrystallite size calculations, as summarized in Table 2.
The crystallite size of the Pt catalyst was larger in the ink and when printed as an electrode layer on the CCM. This increase in crystallite size was revealed by the narrowing of the diffraction peaks seen in Figure 2. Such coarsening of the Pt catalyst may indicate that the ink got too hot during dispersion of the carbon-supported catalyst powder in the solvent. For this reason, the ink is often cooled using a water bath at 5 °C during ultrasonication.5 Changes in crystallite size, such as particle coarsening, during processing can adversely affect catalytic performance.
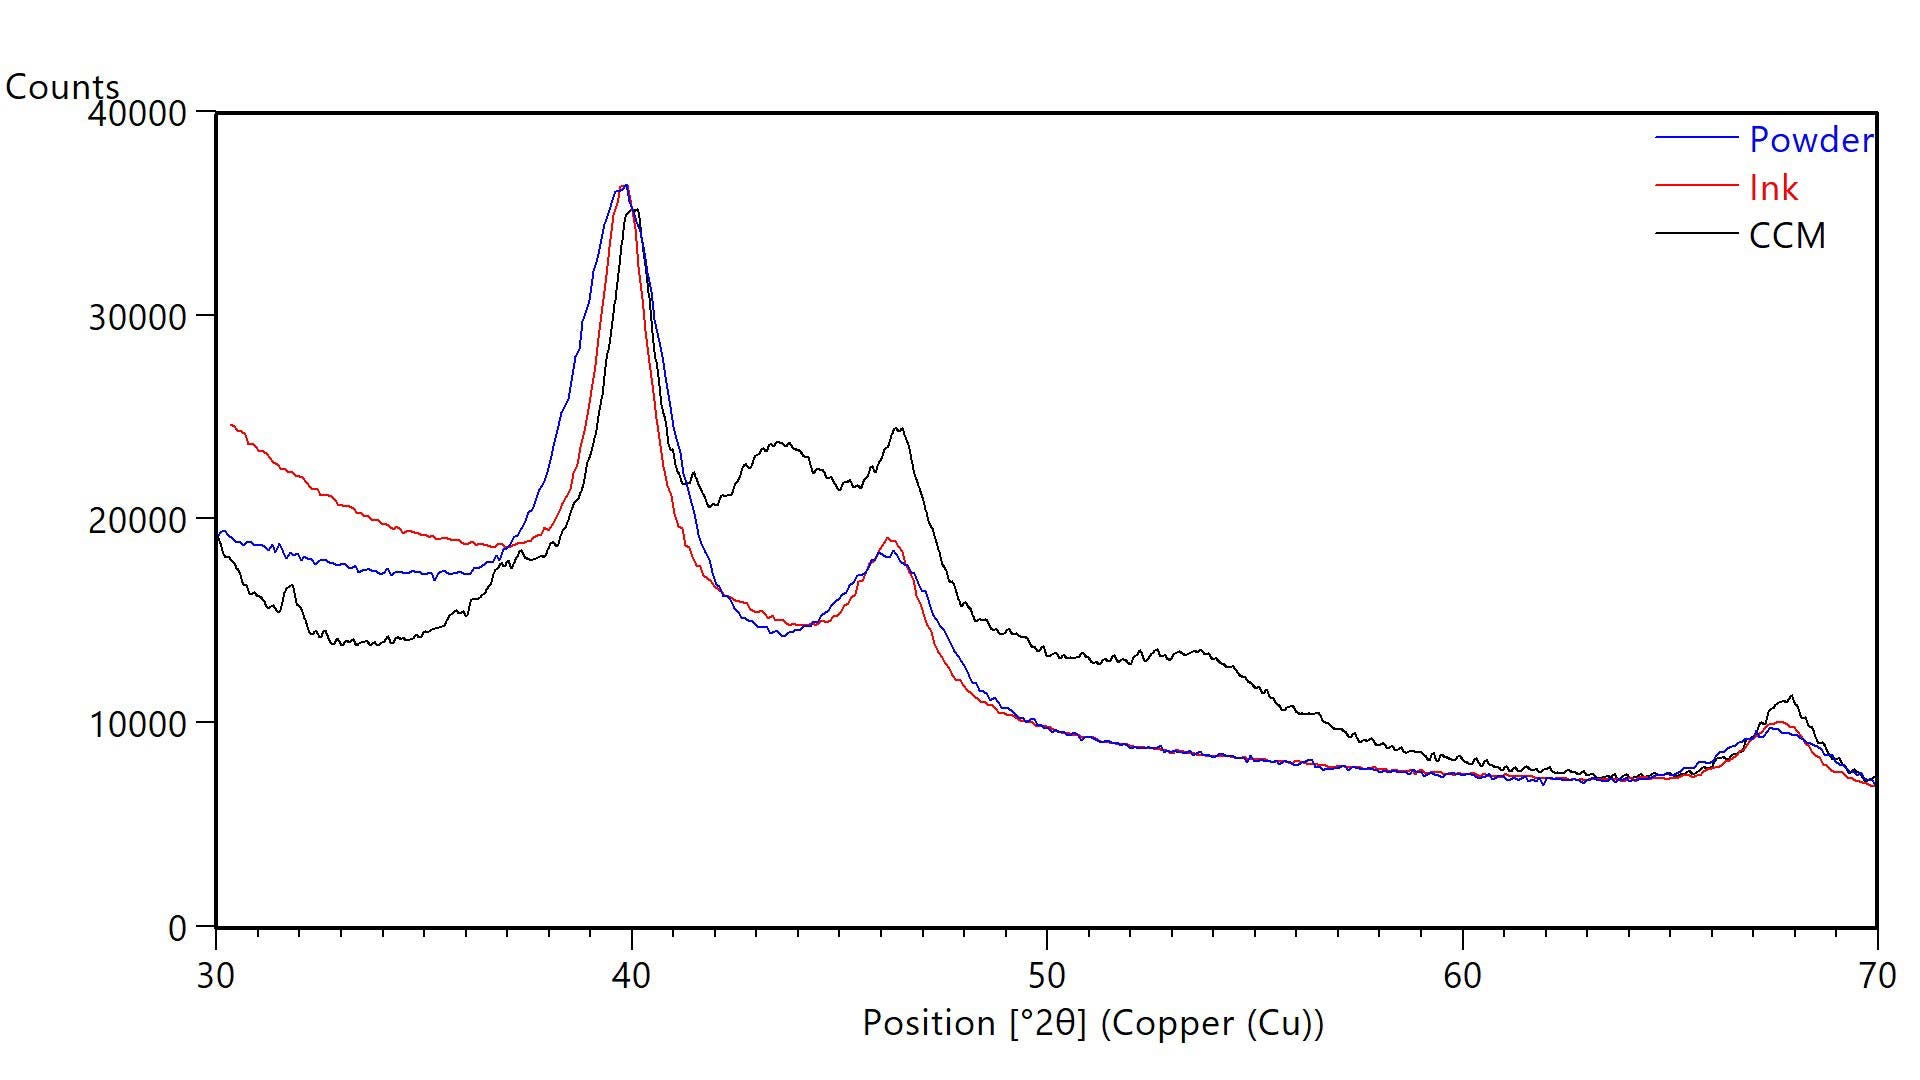
Figure 2 XRD data from powder (blue), ink (red), and catalyst coated membrane (black) each containing carbon-supported catalyst powders of 40% Pt dispersed on Vulcan XC72. Blue lines indicate the published positions of Pt diffraction peaks.
| Crystallite Size (Scherrer Method) nm | |
|---|---|
| Powder (40% Pt on Vulcan XC72) | 3 |
| Ink (40% Pt on Vulcan XC72) | 5 |
| CCM (40% Pt on Vulcan XC72) | 5 |
Laser diffraction (LD) is used to analyze the particle size of dry and wet particulate materials from the 10s of nm to the mm size range. This wide dynamic range makes laser diffraction particularly valuable for particle size analysis of catalytic inks. The rapid measurement time (less than 1 minute) and automation capabilities are well suited to production environments. In addition, laser diffraction measurements can examine the impact of a variety of in situ processing changes on the size distribution of suspended particles.
Figure 3 shows five repeat particle size measurements of a diluted catalytic ink using the Mastersizer 3000 laser diffraction particle size analyzer. The size distribution of the particles in this ink is bimodal, with the largest volume fraction of the material distributed around the 1 µm size range and a smaller volume fraction of material distributed around 20 nm. Summary statistics shown in Table III indicate a high degree of repeatability, with RSDs <1% across the size distribution for this ink sample.
The particles in catalytic inks measured by laser diffraction are typically agglomerates of carbon-supported catalyst particles. Particles in the 100 nm to 1 µm size range are too typical of agglomerates of carbon-supported catalyst particles in well-performing inks. However, the population of particles in the sub-100nm size range observed in Figure 3 suggests that the ink was over-dispersed, indicating that excessive energy inputs during dispersion detached the Pt catalyst particles from the support. Optimization of catalyst particle size is known to strongly impact cell performance. Poorly dispersed catalytic inks result in reduced catalyst utilization and mass transport efficiency, which in turn reduce cell performance. While controlled energy inputs improve the state of dispersion of the catalytic ink (and consequently overall cell performance), excessive energy input during ink dispersion results in eventual detachment of catalyst particles from the support and reduction of cell performance.
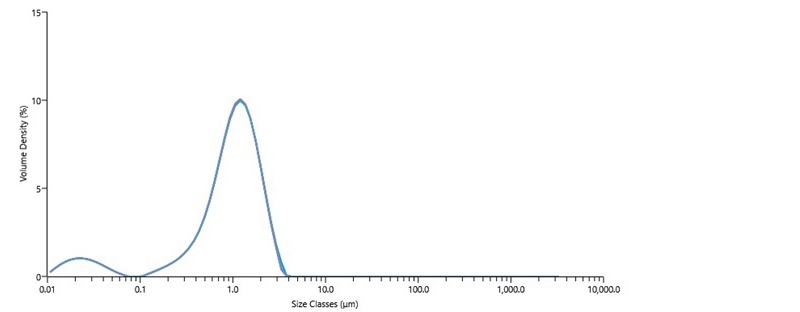
Figure 3 Particle size of catalytic ink, made with 40% Pt on Vulcan XC72 and Nafion ionomer dispersion, measured by Mastersizer 3000 laser diffraction particle size analyzer.
| Dx (10) (µm) | Dx (50) (µm) | Dx (90) (µm) | |
|---|---|---|---|
| Mean | 0.22 | 1.02 | 2.04 |
| Std Dev | 0.00194 | 0.00448 | 0.0174 |
| RSD (%) | 0.882 | 0.437 | 0.852 |
Laser diffraction can study particle friability and optimize dispersion processes. In one experiment, a powder of 40% Pt on Vulcan XC72R was added to isopropanol and dispersed under shear. Figure 4 shows the change in particle size measured over time with the Mastersizer 3000. The population of 10-100 µm agglomerates decreased with time, while the populations below 10um increased. After 2h, a significant population of large agglomerates (>10um) remain, indicating that additional shear or a higher energy dispersion method would be necessary to produce a catalytic ink of acceptable performance.
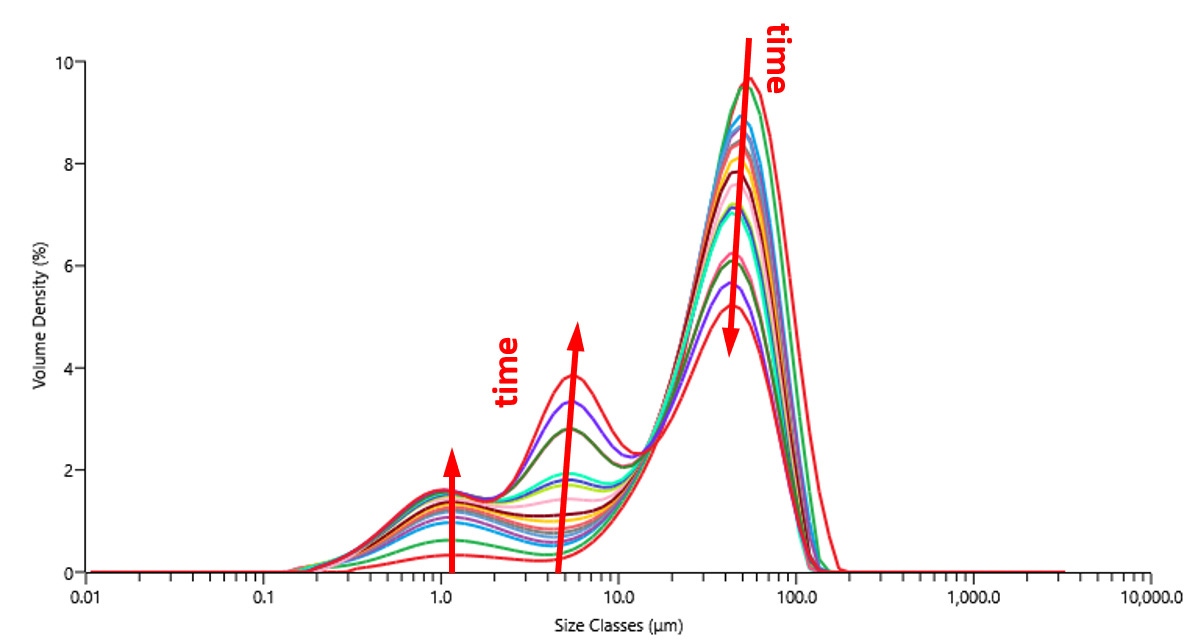
Figure 4 Particle size measured with laser diffraction over time during dispersion under shear.
Dynamic light scattering (DLS) measures mean particle size over a smaller range (1 nm to 1 µm) from more dilute samples than laser diffraction.
A Zetasizer Ultra was used to measure the mean particle size of catalytic ink dispersed in IPA in a 1:10 ratio. The diluted ink was still highly opaque, so non-invasive backscatter (NIBS) was used for the measurements. Five measurements were collected from the diluted ink to evaluate consistency. Figure 5 shows the steady-state correlograms; these were in good agreement despite the opacity of the ink.
Figure 6 shows the size distribution plots. As summarized in Table IV, the reported mean particle size of 1.04 µm was in good agreement with results from laser diffraction. The broadness of the size distribution, indicated by the large (>0.1) polydispersity index, was also in agreement with LD results.
DLS did not readily show the population of smaller aggregates that were observed in LD. The brightness of signal from large particles obscures the signal from smaller particles in DLS analysis.
DLS can also be used to determine the zeta potential of the catalytic ink. Zeta potential changes with ion concentration, which can be controlled by either functionalizing the carbon-support particles or changing the ionomer concentration. Zeta potential can also be used to monitor the interaction of the ionomer with the carbon-supported catalyst, ensuring thorough distribution of the ionomer on the catalyst. A larger zeta potential can improve ink stability, particularly in dispersion media with a higher dielectric constant such as methanol. Zeta potential analysis can be used during formulation to optimize the ink stability. Indeed, models exist that can predict stability of an ink dispersion based on the primary particle size and zeta potential in the dispersion medium.6
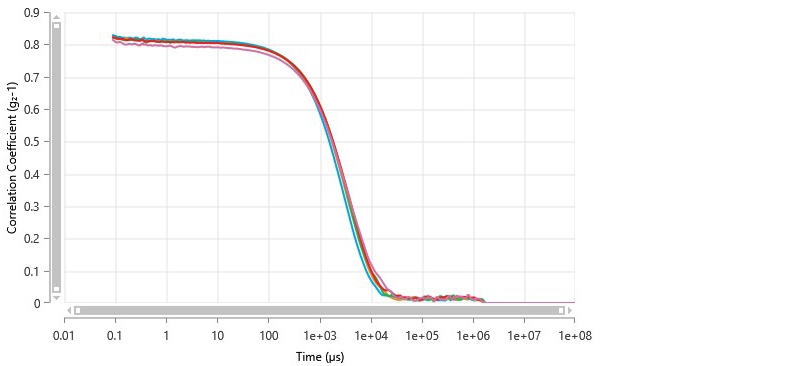
Figure 5 Correlograms of catalytic ink measured by non-invasive backscatter dynamic light scattering.
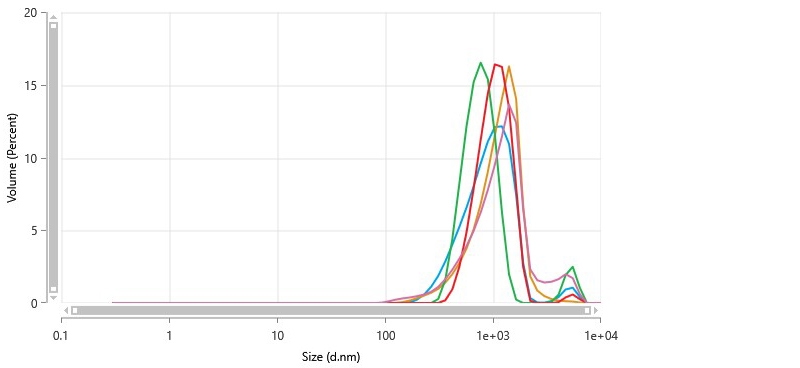
Figure 6 Particle size distribution of catalytic ink determined by non-invasive backscatter detection in a dynamic light scattering measurement.
| Mean | Std Dev | RSD | Min. | Max. | |
|---|---|---|---|---|---|
| Z-Average (nm) | 701.4 | 50.44 | 7.191 | 615.9 | 745 |
| Polydispersity Index (PI) | 0.3298 | 0.07336 | 22.24 | 0.2745 | 0.4555 |
| Peak One Mean by Volume (nm) | 1038 | 176.9 | 17.03 | 774.6 | 1204 |
| Peak One Area by Volume (%) | 96.18 | 3.561 | 3.703 | 91.31 | 100 |
| Peak One Width by Volume (nm) | 421.9 | 136.1 | 32.25 | 240.8 | 558.5 |
The catalytic ink in this study exhibited signs of over-dispersion. X-ray diffraction determined that the crystallite size of the nanocatalyst was larger in the ink and the deposited cathode layer than as-received powder. A common cause of such particle coarsening is overheating of the ink during dispersion. Additionally, laser diffraction detected a significant population of primary particles in the 20 nm size range, consistent with over-dispersion.
Together, laser diffraction, X-ray diffraction, and dynamic light scattering are useful tools for optimizing and monitoring catalytic ink formulation and stabilization. Particle size analysis with the Mastersizer 3000 laser diffraction analyzer evaluates the effectiveness of critical particle dispersion. Zeta potential measurements with Zetasizer dynamic light scattering analyzer probes the interaction of the ionomer with the carbon-supported catalyst to predict ink stability. X-ray diffraction with the Aeris benchtop X-ray diffractometer measures the size of the nanocatalyst and the effectiveness of methods used to prevent nanoparticle coarsening.