Cement is a composite material which may contain more than 20 components. Use of Morphologically-Directed Raman Spectroscopy (MDRS) available on the Malvern Panalytical Morphologi ID system enables the individual components to be characterized for particle size and particle shape. Increased understanding of the particulate composition of cements is vital for reduction of production costs and the optimization of cement blends.
Around 3 billion tons of cement are produced every year [1, 2] accounting for 10-15 % of global energy usage in industry [1] and up to 10 % of global CO2 production [1,2]. The continuing growth of developing nations is creating an ever growing demand for cement, which means energy use and CO2 production will only increase. This brings inherent cost and environmental social responsibility concerns.
Around half of the CO2 emissions associated with cement production come from the calcination of limestone [1]. The calcination of limestone produces clinker, which when mixed with gypsum is known as Portland cement and is generally the main ingredient of cements and concretes used today.
However, cement has not always been based on Portland cement, Pozzolan-lime cements were used by the Romans. Roman structures made using Pozzolan based cements are still standing after 2000 years, perhaps most famously the Pantheon in Rome. Pozzolan cements develop strength slowly, they are slower to set which makes Pozzolan cement easier to work with when first poured, but over time Pozzolan cements become stronger than Portland cement [2,3,4].
Increasingly industrial cement production is using Pozzolan materials such as fly-ash and volcanic-ash, to replace a proportion of the Portland cement [2,3,4]. This reduces CO2 emissions and cost but doing so can also have beneficial effects as shown by the longevity of the Pantheon. Further understanding the cement product at the particle level can help maximize the benefits and minimize the costs.
Using the Morphologi ID the particle size and shape of various components in a cement blend can be individually characterized by Morphologically-Directed Raman spectroscopy (MDRS). Results can be used to compare batches or products, to aid the understanding of product development or to solve a production problem.
Five different cement samples were chosen from two different manufacturers for investigation using the Morphologi ID.
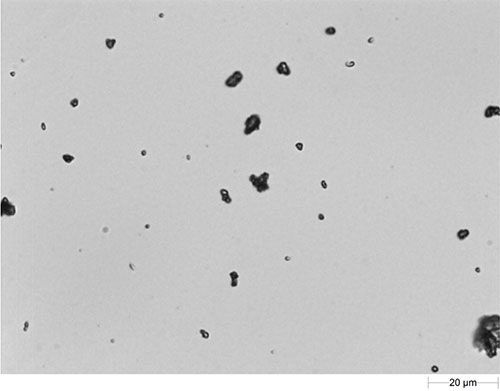
Cement can be dispersed well using an evaporative technique where small aliquot of cement is suspended in a solvent and ultrasound is used to aid dispersion. An aliquot of the suspension is spread onto a microscope slide and allowed to dry prior to analysis. An example image of such a dispersion is shown in Figure 1.
|
During MDRS a morphological image analysis is first performed on the sample. Size and shape information is obtained from the particle images. The positional information from this analysis is used to automatically return to the particles of interest from which Raman spectra are to be acquired.
A reference library is created by acquiring spectra from pure components. The particle spectra are compared to the reference spectra and a correlation calculation is performed. A high correlation score indicates a good match between the reference and the particle spectrum and a low score indicates no match. In this way particles are classified as individual components using the Raman spectroscopy results.
The morphological analysis was carried out using the 50x objective. A post analysis shape filter was applied to exclude images of touching particles from the analysis. For this study between 1000 and 2000 particles larger than 3 µm were targeted for chemical analysis and a 30 second per particle acquisition time was used.
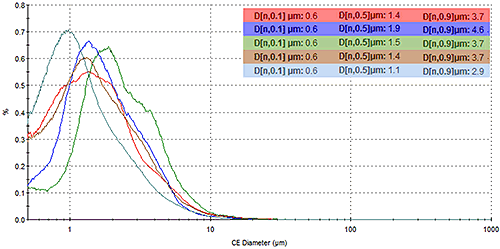
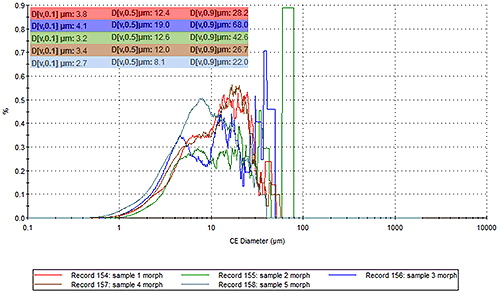
Particle size distributions are often reported in terms of the Circular Equivalent Diameter (CED); the diameter of a circle with the same area as that of the particle analyzed. Figure 2 shows overlays of the number and volume based CED particle size distributions. Since image analysis is a number based counting technique, where every particle has an equal weighting in the distribution, a number based distribution is a natural way to view results. A cubic transformation enables the particle size distributions to be viewed by volume.
|
|
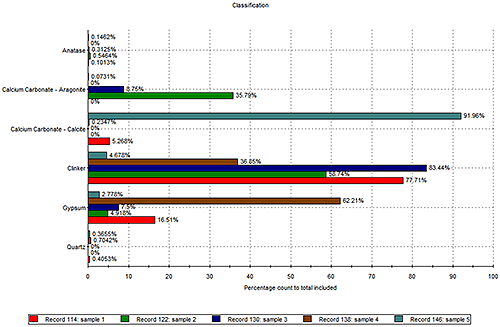
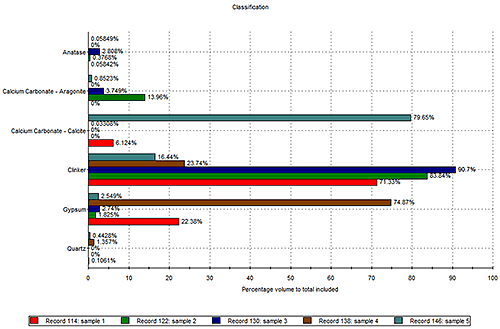
To identify the proportion of each component present in the cement samples, individual particles are classified as being one specific component based on the correlation score to the reference spectra. Cement can contain more than 20 components including various polymorphs. In this study six of the most common components namely clinker, quartz, gypsum, anatase and two polymorphs of calcium carbonate have been classified. Figure 3 presents results as classification charts.
|
|
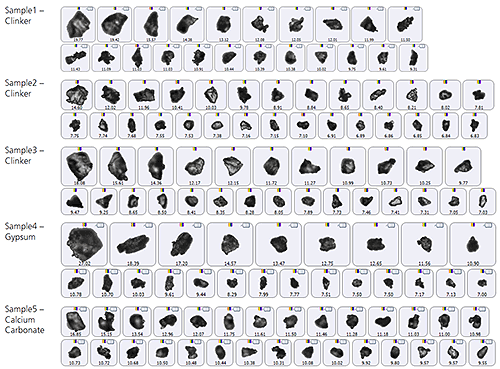
The majority of particles in samples 1, 2 and 3 are clinker. Sample 4 contains more gypsum particles rather than clinker while sample 5 has more calcium carbonate present. The Morphologi ID is an imaging technique and as such saves an image of every particle analyzed. Figure 4 shows example particle images from the most abundant components in each sample. For samples 4 and 5 the gypsum and calcium carbonate may be being used instead of clinker as filler in these cements.
|
Clinker is typically the main component in cement, and given its high production cost, is of interest to characterize. The Morphologi ID allows information on specific components of interest in the cement to be assessed individually. Figure 5 shows number and volume based overlays of the CED distributions for particles characterized as clinker in the five samples.
By number, samples 1 to 4 appear similar but sample 5 contains more clinker particles larger than 6 µm CED. The volume result reveals differences between the five samples, particularly in the below 10 µm range with sample 4 containing the greatest amount of fine material.
The Morphologi ID was used to perform Morphologically-Directed Raman Spectroscopy (MDRS) on five different cement samples. The particle size distribution of each cement blend was measured and the proportions of six components in each blend were characterized.
By using the Morphologi ID the proportions, size and shape of components in the cement are measured, and understanding of the processing and blending of the cement is improved. This could help understand the properties of the final product and therefore aid product development. This sort of characterization can also be used to reverse engineer a cement product with desirable qualities.