
This datasheet shows the analytical performance of the Epsilon 1 for a full analysis of limestone prepared as pressed powder pellets.
Limestone is a mineral used in numerous applications in a large number of industries. Examples are, as a principal raw material in the cement industry, as an additive in steel making or as an important component in the float glass industry. For these applications it is important to know the exact composition of limestone, where CaO, Al2O3, SiO2, MgO and Fe2O3 are the main elements of interest. Although limestone is excavated and used for thousands of years, current environmental legislations demand miners to continue excavating parts of existing quarries, with so-called fringe material. Here, the composition of limestone is more inconsistent.
Limestone is a mineral used in numerous applications in a large number of industries. Examples are, as a principal raw material in the cement industry, as an additive in steel making or as an important component in the float glass industry. For these applications it is important to know the exact composition of limestone, where CaO, Al2O3, SiO2, MgO and Fe2O3 are the main elements of interest. Although limestone is excavated and used for thousands of years, current environmental legislations demand miners to continue excavating parts of existing quarries, with so-called fringe material. Here, the composition of limestone is more inconsistent. The Epsilon 1, a transportable X-ray fluorescence spectrometer (XRF), can be put in the back of the car and can analyze limestone directly in the quarry, making it easier to determine the best place to excavate. This datasheet shows the analytical performance of the Epsilon 1 for a full analysis of limestone prepared as pressed powder pellets.
Measurements were performed using an Epsilon 1 EDXRF spectrometer, equipped with a 50 kV silver X-ray anode tube, 6 filters and a high-resolution silicon drift detector (SDD). The data was automatically processed by the Epsilon 1 software.
The calibration was set up using 10 different commercially available standards, which were measured as pressed pellets samples. Each pellet comprised 12 g sample powder mixed with 3 g of binder (Ultrawax) and pressed at 20 tons.
Three measuring conditions were used to set up the calibration for all major and trace compounds (Table 1). Figure 1 shows a spectrum of a limestone standard obtained with the first condition. The total measurement time per sample was 10 minutes.
Table 1. Measurement conditions used for the characterization of pressed limestone sample
| Element | kV | μA | Medium | Filter | Measurement time (min) |
| MgO, Al2O3, SiO2, P2O5, SO3 | 10 | 73 | Air | none | 6 |
| K2O, CaO, TiO2, MnO | 12 | 344 | Air | AI-thin | 2 |
| SrO, Pb, Fe2O3 | 50 | 100 | Air | Ag | 2 |
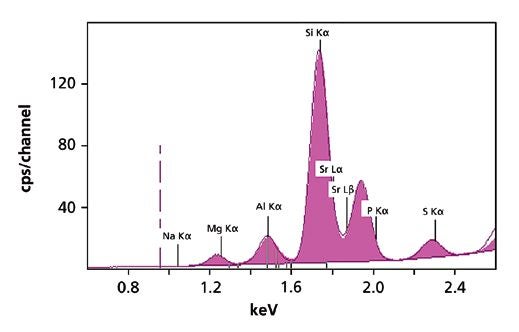
Figure 1. XRF spectrum of a limestone standard, measured with the first condition.
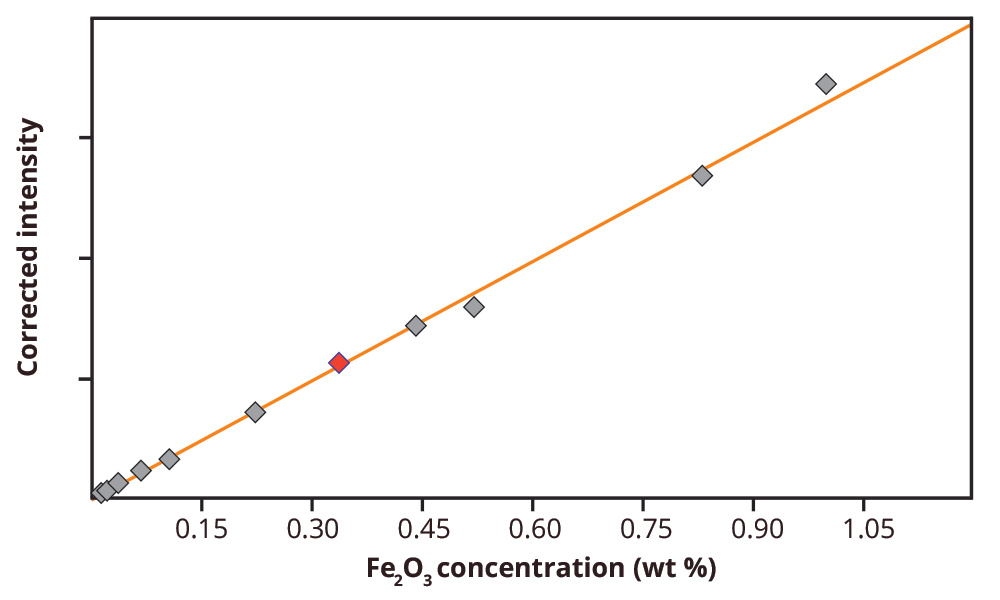
A calibration was set up for multiple compounds present in the calibration standards. The calibration results are summarized in Table 2. As an example, in Figure 2 the calibration graph for Fe2O3 in limestone is shown. The calibration results show high correlations between the measured intensities and certified concentrations for most of the compounds. Also the Root Mean Square values (1-sigma standard deviation) is included in Table 2.
Table 2. Calibration details (* RMS: The more accurate calibrations have the smaller RMS values.
| Compound | Concentration range (wt %) | Correlation coefficient | RMS* (wt %) |
| CaO | 29.95- 55.59 | 0.9998 | 0.23 |
| AI203 | 0.021- 1.300 | 0.9977 | 0.074 |
| Fe2O3 | 0.018- 1.040 | 0.9986 | 0.026 |
| MgO | 0.155- 17.500 | 0.9949 | 0.327 |
| SiO2 | 0.120- 9.500 | 0.9935 | 0.414 |
| SrO | 0.018- 0.280 | 0.9999 | 0.414 |
| K2O | 0.003- 0.430 | 0.9998 | 0.007 |
| MnO | 0.0021- 0.0420 | 0.9762 | 0.003 |
| P2Os | 0.001- 0.048 | 0.9108 | 0.010 |
| SO3 | 0.0170- 0.1970 | 0.9643 | 0.014 |
| TiO2 | 0.002- 0.150 | 0.9982 | 0.003 |
| Pb (ppm) | 0.7- 15 | 0.9967 | 0.8 |
Figure 2. Calibration graph for Fe2O3 in limestone. The red dot represents the standard SX 35-14 that is used to validate the method.
To test the accuracy and precision of the calibration, one of the CRM standards, SX 35-14 (Dillinger Hütte laboratory), was measured 20 times and the results were compared with the certified values. To show the effect of measurement time on the precision of the results, the repeatability test was carried out with shorter measurement times as well (see Table 3). The results are summarized in Table 4 and graphically illustrated in Figure 3 for CaO. For most compounds the results correlate closely with the certified concentrations, also for the faster measurements. The RMS values increase with shorter meas- urement times. This is illustrated in Figure 3 with the dashed lines, showing 2 times RMS (2σ, 95% probability) for the 10 and 2 min. measurement times
Table 3. Overview of the total measurement times with corresponding times per condition, which were used for the precision measurements.
| Total measurement time | |||
| Compound | 10 mins | 5 mins | 2 mins |
| MgO, Al2O3, SiO2, P2O5, SO3 | 6 mins | 3 mins | 1 min |
| K2O, CaO, TiO2, MnO | 2 mins | 1 min | 30 sec |
| SrO, Pb, Fe2O3 | 2 mins | 1 min | 30 sec |
Figure 3. Graphical representation of the 10 min and 2 min repeatability measurements for CaO in standard SX 35-14. The dashed lines illustrate 2σ (2 times RMS, 95% probability) of each measurement time (10 min blue, 2 min red).
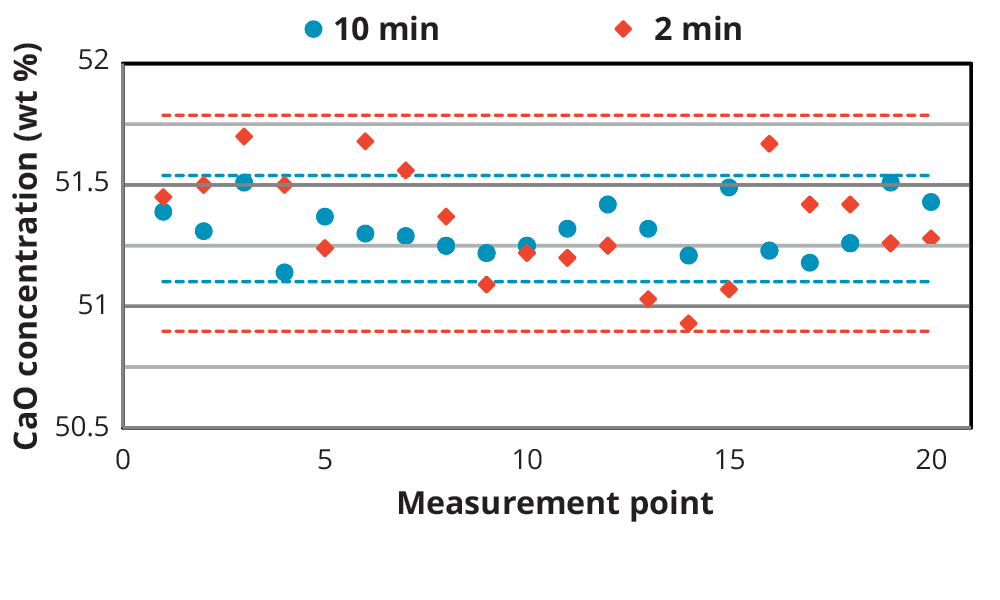
Table 4. Repeatability results of 20 measurements on a limestone certified standard (SX 35-14), measured with different measuring times
| Certified | 10 mins | 5 mins | 2 mins | |||
| Compound | Conc. (wt %) | RMS (wt %) | Avg. (wt %) | RMS (wt %) | RMS (wt %) | RMS (wt %) |
| CaO | 51.49 | 0.09 | 51.32 | 0.11 | 0.15 | 0.22 |
| AI2O3 | 0.483 | 0.006 | 0.457 | 0.019 | 0.019 | 0.032 |
| Fe2O3 | 0.422 | 0.004 | 0.428 | 0.003 | 0.003 | 0.005 |
| MgO | 2.161 | 0.008 | 2.526 | 0.133 | 0.187 | 0.236 |
| SiO2 | 2.533 | 0.011 | 2.398 | 0.011 | 0.015 | 0.032 |
| SrO | 0.030 | 0.001 | 0.028 | 0.0000 | 0.0000 | 0.0004 |
| K2O | 0.075 | 0.003 | 0.065 | 0.002 | 0.002 | 0.003 |
| MnO | 0.020 | <0.001 | 0.018 | 0.0011 | 0.0016 | 0.0024 |
| P2O5 | 0.034 | 0.001 | 0.037 | 0.003 | 0.003 | 0.007 |
| SO3 | 0.197 | 0.005 | 0.200 | 0.002 | 0.002 | 0.004 |
| TiO2 | 0.023 | 0.001 | 0.022 | 0.001 | 0.001 | 0.002 |
| Pb (ppm) | Not certified | - | 4.9 | 1.0 | 1.9 | 2.0 |
The results clearly demonstrate the capability of the Epsilon 1 as a fast analysis tool for major and trace compounds in limestone.
The high performance of the silicon drift detector in the Epsilon 1 makes it possible to get accurate and fast measurements for multiple elements present in limestone in only 10 minutes.
The Epsilon 1 can be operated in the back of a car in the quarry, allowing an accurate determination of all important elements in limestone at different places in the quarry.