This application note shows that the Epsilon 4 is fully capable of analyzing Fe2O3, Al2O3, SiO2, SO3, P2O5, CaO, Mn3O4, MgO, and TiO2 in iron ore samples.
Iron ore is mainly used as a raw material in the steel and cement industries. Accurate elemental analysis of iron ore samples plays a very important role in iron ore mine mapping and iron ore pricing. XRF analysis provides a useful tool for classifying and controlling the quality of the iron ore composition.
This application note shows that the Epsilon 4 - a high-performance energy dispersive X-ray fluorescence spectrometer is fully capable of analyzing Fe2O3, Al2O3, SiO2, SO3, P2O5, CaO, Mn3O4, MgO, and TiO2 in iron ore samples.
Iron ore is mainly used as a raw material in the steel and cement industries. Accurate elemental analysis of iron ore samples plays a very important role in iron ore mine mapping and iron ore pricing. XRF analysis provides a useful tool for classifying and controlling the quality of the iron ore composition.
40 mm diameter beads were prepared by fusing 1 gram iron ore sample material in 10 grams of flux (Li2B4O7). The bead samples were put in standard sample holders and loaded in the Epsilon 4.
Measurements were performed using an Epsilon 4 EDXRF spectrometer, equipped with a 10W, 50 kV rhodium anode X-ray tube, 6 filters, a helium purge facility, a high-resolution silicon drift detector, a spinner and a 10-position removable sample changer.
11 international certified iron ore standards were used to set up the calibration. Two different measurement conditions were used, each one optimizing the excitation of a group of elements. These measurement conditions are given in Table 1.
Table 1. Measurement conditions

Figure 1. The spectrum of a CRM standard obtained with 7 kV showing the excellent resolution and the high sensitivity of the detector
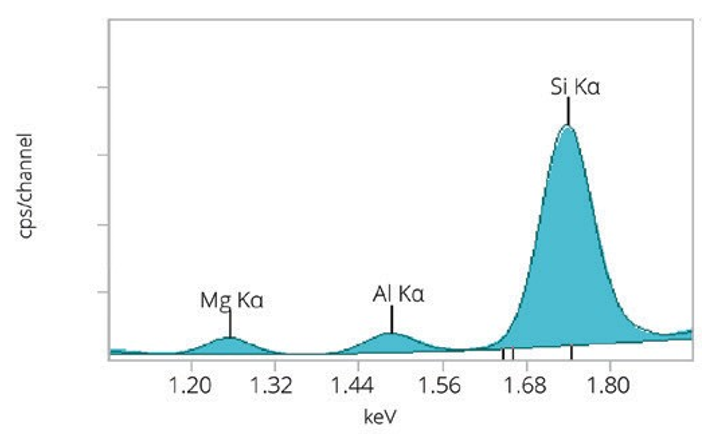
Figure 2. Calibration graph for SiO2
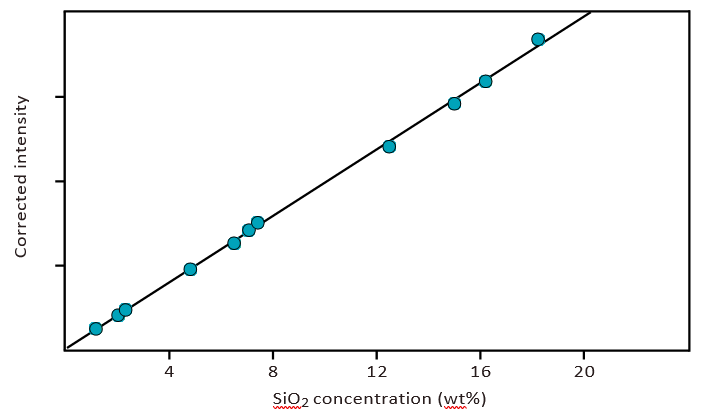
Figure 3. Calibration graph for CaO
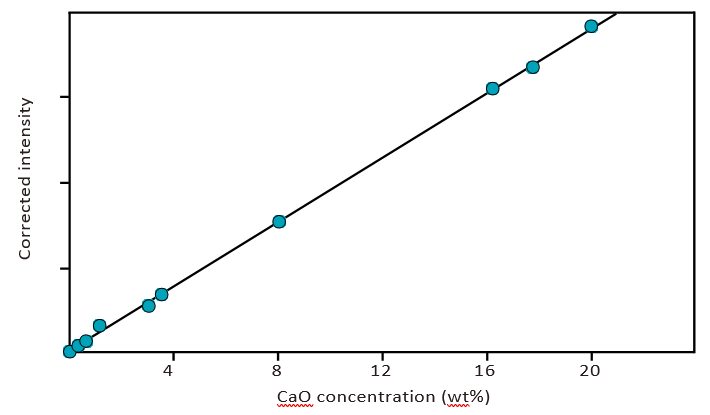
Figure 4. Calibration graph for Fe2O3
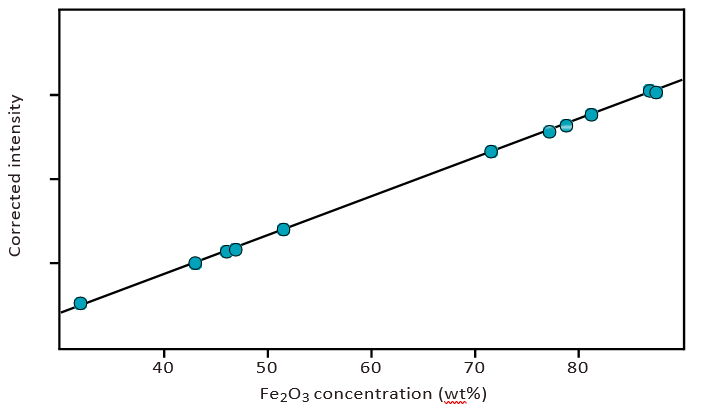
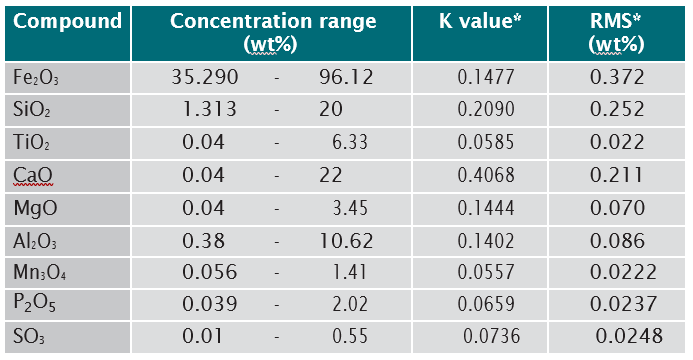
The calibration plots shown in Figures 2 to 4 demonstrate the good correlation between the certified concentrations and the measured intensities. Table 2 presents the RMS of the calibration.
Table 2. The RMS values of the calibration
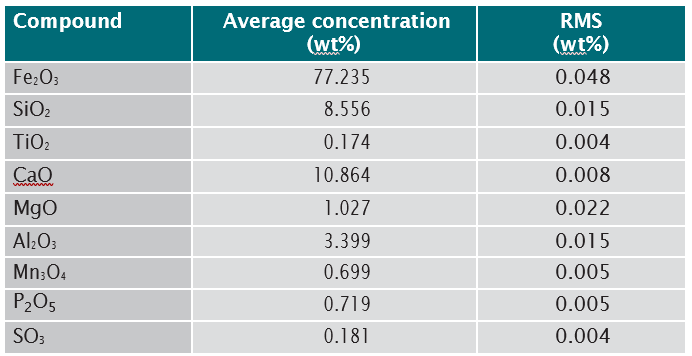
One sample was measured 20 times consecutively. The average concentration and the absolute RMS (1 sigma standard deviation) are presented in Table 3.
Table 3. Results of the repeatability test
The data presented here clearly demonstrate the suitability of the Epsilon 4 EDXRF spectrometer for the quantitative analysis of Fe2O3, Al2O3, SiO2, SO3, P2O5, CaO, Mn3O4, MgO, and TiO2, in
iron ore samples. Accurate and precise results can be obtained in just 3 minutes.