
제약 산업의 새로운 미래-리버스 엔지니어링(reverse engineering)
리버스 엔지니어링이란?
흔히 컴퓨터 공학에서 많이 사용하는 단어입니다.
완성된 제품을 분석하여 제품의 기본적인 설계 개념과 적용 기술을 파악하고 재현하는 것을 말합니다.
설계 개념→개발 작업→제품화의 통상적인 추진 과정을 거꾸로 수행하는 학문이며 보통 소프트웨어 제품은 판매 시 소스는 제공하지 않으나 각종 도구를 활용하여 컴파일된 실행 파일과 동작 상태를 정밀 분석하면 그 프로그램의 내부 동작과 설계 개념을 어느 정도 추적할 수 있다는 것을 활용한 것입니다.
이러한 정보를 이용하면 크랙, 즉 실행 파일을 수정하거나 프로그램의 동작을 변경할 수 있고, 또 유사한 동작의 복제 프로그램이나 보다 기능이 향상된 프로그램도 개발할 수 있다.
이러한 개념이 이제 제약산업에 접목되기 시작하였습니다.
그럼 아래 응용 자료를 통해 자세한 내용을 알아보겠습니다.

REVERSE ENGINEERING
PHARMACEUTICAL FORMULATION
USING THE MORPHOLOGI G3-ID
Introduction
According to the definition established by the FDA, a generic drug is “a drug product which is comparable to a reference listed drug (RLD) product in dosage form, strength, route of administration, quality, performance characteristics, and intended use”.
Rigorous rules and regulations pertaining to abbreviated new drug application (ANDA) submissions are complex and the generic drug industry strives to meet these regulations to obtain FDA’s approval.
And being the “first to file” is the most fundamental principle in the generics business because several companies compete to create generics of successful products going off patent.
Therefore, generics companies must be highly skilled and disciplined in product development and achieving bioequivalence—the most critical development area.
Though generics companies commonly use reverse engineering techniques, the topic and, more importantly, the tools needed to carry out the process are rarely discussed in the public domain.
In this application note we discuss one such tool that can be used for
oral solid dose formulations.
Case Study
Two cold remedy formulations were analysed on the Morphologi G3-ID: one was a commercial brand and the other a generic one. Individual components within the formulations were identified by comparing their Raman spectra with those in a commercial database.
Once the components were identified the particle size distributions of individual components in each formulation were compared, as was the overall composition of the two formulations.
Methodology
The cold remedies were dry powder formulations that were automatically dispersed and analysed using the Morphologi G3S-ID. 13 mm3 of sample was dispersed using the instrument’s integrated dry powder dispersion unit using the low pressure dispersion option.

Figure 1 shows an example image of one of the dispersed samples. The samples were morphologically analysed using the 5 x objective. Particles with a circular equivalent diameter (CED) larger than 25 μm were targeted for the Raman chemical identification.
In this case the acquisition time was 10 seconds for each particle and spectra from a few thousand particles from each sample were gathered in an overnight analysis.
Results and discussion
Figure 2 presents the overlays of the Circular Equivalent Diameter (CED) particle size distributions of the two cold remedies by number and volume respectively. The commercial brand contains more particles in the 30 to 200 μm range than the generic brand.

The number based distribution indicates the commercial brand also contains more fine particles less than 20 μm in size.
Component identification
Both of the cold remedies are made of more than ten components, including the two active pharmaceutical ingredients (APIs)
Paracetamol and Phenylephrine.
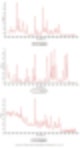
Since pure materials were not available from which to create reference libraries, Raman spectra acquired by the Morphologi G3-ID from 11 different components were identified and these were used as reference library spectra. As examples, the reference spectra for the components 1, 2 and 11 are displayed in figure 3.
Based on the reference spectra, it is possible to classify individual particles as being one of the formulation components.
During this classification process a correlation calculation is performed between each particle’s spectrum and the reference spectra and a
correlation score generated.
A score close to 1 indicates a good match whereas a score close to zero indicates no match. Chemical classifications based on these correlation scores were applied to the results to identify the proportion of each component present in the two formulations.

The results of the volume based classifications and are presented in figure 4. The three most common components in both formulations were components 1, 2 and 11. The commercial product contains more of component 1 than the generic product whereas the generic product was found to contain more of component 2.
Some of the components were identified by performing an advanced spectrum search using Thermo Scientific’s online database ‘ftirsearch.com.’ Figure 5 shows the result for the identification of Components 1, 2 and 11.

Component 2 was found to be the API Acetaminophen (Paracetamol). Components 1 and 11 were found to be different forms of sucrose.
Individual component size distributions

Figure 6 presents the overlay of the volume based CED size distributions for the particles that were classed as Paracetamol in each
sample along with example particle images. The generic product contains larger particles of Paracetamol than the commercial
product.
Whilst component 7 was not found to be very abundant in either sample, on comparing the particle shape of the various
components, it was found to be considerably more elongated (needle-like) than the others.

Figure 7 presents the scattergram of correlation score to component 7 vs. elongation. It shows that all particles with a high correlation score to reference component 7 do have a high elongation. The particle images shown in the top left of the figure also confirm this.
An advanced spectrum search was performed on the reference spectrum for component 7 and it was found to be Aspartame,
another form of sweetener (figure 8).

The generic product contained significantly more Aspartame while the commercial product contained significantly more Sucrose. This may suggest the generic product uses more artificial sweetener to red