
This application note describes how X-ray diffraction (XRD) studies can be used in the study of coal and coal-related materials.
Mineral phases identified and quantified in raw coal are quartz, kaolinite, and minor amounts of calcite, dolomite, siderite and anatase.
High-speed XRD systems such as the CubiX3 Minerals equipped with the X'Celerator detector allow the use of standardless methods such as Rietveld refinement for non-destructive analysis of coal and coal-related products. This method, therefore, provides a fast and reliable alternative to time- consuming traditional methods.
Coal is still one of the major energy sources. In the metallurgical industry it is used as a reducing agent in the manufacture of iron and steel, ferro-alloys and many non-ferrous metals. A fast and accurate check of the ash content and the mineral matter in coal enables the early recognition of coal quality and makes fast counteractions possible. This application note describes how X-ray diffraction (XRD) can be used in the study of coal and coal-related materials. Mineral phases identified and quantified in raw coal are quartz, kaolinite, and minor amounts of calcite, dolomite, siderite and anatase.
• Fast and non-destructive determination of coal/ash ratio
• Reduction of costs and energy by optimizing the milling process to find the most effective particle size for combustion
• Easy crystallite size and graphitization determination for better performance of carbon materials such as carbon anodes for aluminum smelters
• Easy and fast identification of minerals in coal compared to microscopic methods
• All applications are automatable, operator-independent, non- destructive and do not require special chemicals or difficult sample preparation
The high-speed CubiX3 Minerals XRD system equipped with the X’Celerator detector allows the use of standardless methods such as Rietveld refinement for the analysis of coal and coal-related products. Besides the fast and non- destructive analysis of existing mineral phases and respectively the ash content, XRD can also be used to analyze crystallite size and graphitization. Therefore X-ray diffraction is a fast and reliable alternative to time-consuming traditional methods.
Samples were milled in a swing mill using a steel vessel. The samples were then prepared using a back- loading preparation method. Alternatively the samples can be pressed into steel rings, which are also suitable for automation.
The measurements were performed on a PANalytical CubiX3 Minerals using an X’Celerator detector and Ni-filtered Cu radiation
Configuration and measurement conditions
| Instrument | CubiX3 Minerals |
| X-ray tube | Cu LFF |
| Incident beam optics | Fixed divergence slits 1/2 degree, mask 15 mm, 0.04 rad Soller slits |
| Sample stage | Spinning sample stage |
| Diffracted beam optics | Fixed anti-scatter slits 1/2 degree, 0.04 rad Soller slits, nickel filter |
| Detector | X'Cellerator |
| Scan time | 8 minutes |
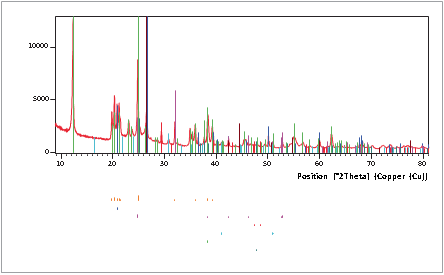
XRD can identify the presence of mineral phases in coal and coal-related materials. Figure 1 shows such a phase identification of a raw coal sample with high mineral content. The mineral content is the main source of the elements that make up the ash when coal is burned. The HighScore Plus software in combination with the PAN-ICSD database was used for the phase identification. Besides graphitic carbon, six different mineral phases were identified in the raw coal sample shown in Figure 1.
• quartz (SiO2)
• kaolinite (Al2Si2O5(OH)4)
• calcite (CaCO3)
• dolomite (CaMg(CO3)2)
• siderite (FeCO3)
• anatase (TiO2)
Organic material, mainly in the form of carbon, is represented in the scan by the hump at about 25 °2θ.
Figure 1. Phase identification results of a raw coal sample
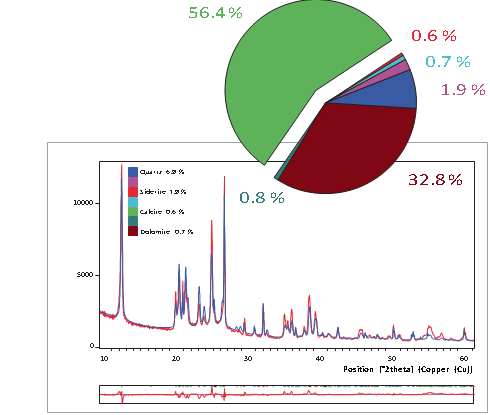
The analysis of coal and coal-related materials with the standardless Rietveld method has several advantages compared to classical quantification methods. All crystalline phases can be determined in just a few minutes. In addition, the amount of amorphous carbon content can be calculated. Line overlaps, sample height and preferred orientation do not influence the results. Crucial process and quality parameters such as the total ash content can be calculated directly from the phase quantification. No standards, monitors or calibration are needed for this. Figure 2 shows the quantification of a raw coal sample using Rietveld refinement. In this example the dry ash content was found to be 63% (quartz plus kaolinite). This corresponds with a classically determined loss of ignition (LOI) of 37%, which includes the contribution of the dehydration of kaolinite in addition to the vitalization of the organic carbon. The latter explains the difference between the LOI and the organic carbon calculated by XRD. For this sample the contribution of the carbonates is negligible.
For effective combustion, coal needs to be milled to a specific particle size. The erosion and abrasion of the mills are associated with minerals such as quartz and pyrite. Coal with higher quartz- to-kaolinite ratio needs less grinding time than coal with a lower ratio. Mineral quantification can be used to adjust the mills, resulting in energy and consumables savings.
Figure 2. Quantification results of a raw coal sample using the Rietveld method
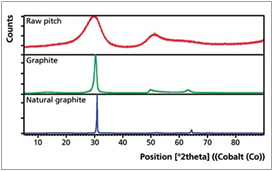
In addition to the analysis of raw coal, XRD can also be used to characterize the crystal structure of graphitic carbons. During the graphitization process the degree of ordering within the crystal structure increases. This is reflected in changes of the lattice parameters and crystallite size, represented by the interplanar spacing d002 (defined by position) as well as the crystallite size Lc (defined by full width half maximum, FWHM) of the graphite peak, Figure 3.
Figure 3. Crystallite size development and corresponding XRD scans of raw pitch, graphite and natural graphite
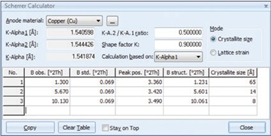
The interplanar spacing d002 between individual graphene layers (3.345 Å for pure graphite), can be used as an indicator of the degree of graphitization g, which is a function of heat treatment. Using the equation according to Maire & Mering the degree of graphitization g can be calculated (1970).The software package HighScore incorporates a tool (Scherrer calculator) to quantify the crystallite size Lc from the peak broadening of the graphite peaks, Figure 5. Crystallite size Lc and graphitization g influence the performance characteristics such as electrical resistivity, conduction, thermal expansion and efficiency of carbon materials such as carbon anodes used for aluminium production. Better control of these properties leads to faster process control, less energy consumption and better quality of the graphitic carbon produced.
Figure 4. Indices of interest in graphitic carbons
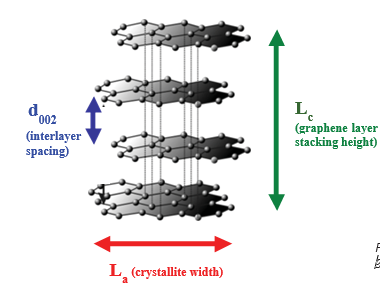
Figure 5. Screen shot of the Scherrer calculator tool in HighScore with Lc values
References:
Maire & Mering, J. (1970), Chem. Phys. Carbon, 6, 125