Living in a modern digital environment, our life and work is based on the completeness of information, and the more we see the more we understand. X-ray diffraction helps non-destructively reveal the identity and quantity of materials. With the introduction by PANalytical, in 2001, of the first laboratory 1D detector, the XRD data collection time has been reduced more than 100 times from hours to minutes while significantly increasing the throughput of the sample measurements or data counting statistics. However, speed is just one of the factors that can influence the XRD data quality. Another important factor is the peak-to-background ratio which could be negatively affected by fluorescent materials. For example, with a Cu X-ray tube, the fluorescence produced by the Fe, Co elements in a mineral can cause an elevated background that covers the minor phase diffraction peaks therefore leading to an inaccurate quantification results. Classically, the use of a diffracted beam monochromator can resolve this challenge. However, this solution reduces diffraction intensity and therefore require a longer measurement time. In order to resolve the speed vs. data quality dilemma for all elements and aiming to bring the best product to every user, we introduce the new strip detector, 1Der, providing an unrivaled energy resolution performance across all applications.
In this webinar, we will use some examples to demonstrate the unprecedented performance and diffraction details that are “seen” by the Empyrean XRD system equipped with the energy-discriminative detector 1Der. We will see:
1. Data from multiple X-ray sources covering a range of today’s cutting-edge applications.
2. How to reduce the background when the fluorescent photon energy of the measured sample (containing Cu or Ni elements) is very close to the Cu-Kα photon’s characteristic energy of ~ 8.04 keV?
3. How a simple functional switch is allowing us to see the monochromatic peaks without the influence of the Cu-Kα2 peaks.
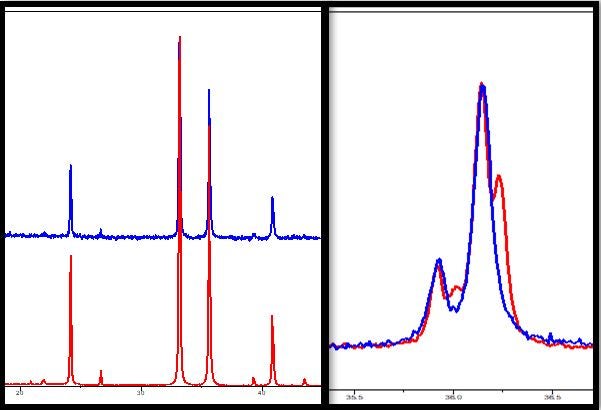
Figure 1. The XRD data collected with 1Der detector. (left) The red curve is collected with fluorescence exclusion mode turned on. (right), blue curve shows the monochromatic data collected with a simple divergence slit optic.
presentadores
Zhaohui Bao - Application Specialist XRD
Más información
- Who should attend?
All XRD users working on powder and polycrystalline materials,
like: geologist, those in mining, chemists, metal engineers, academia researchers, those working within the cement industry and or the food and pharmaceuticals space.
- What will you learn?
The evolution of XRPD technology on data quality improvement
How to obtain the best XRPD data by filtering out fluorescence