Liposomes are used as a vehicle for intravenously delivered drugs, gene therapy and functional cosmetics. Measurement of the size and zeta potential can be used to increase retention in the body, and develop aggregation resistant formulations. Special categories are small unilamellar vesicles SUV, large unilamellar vesicles LUV, multilamellar vesicles MLV.
Size and zeta potential of liposomes play an important role for designing drug delivery vehicles such as for small interfering RNA siRNA or messenger RNA mRNA gene delivery.
Liposomes are vesicles composed of a bilayer of lipid molecules enclosing an aqueous volume [1].
They were initially used as model systems to study membrane properties such as permeability [2]. Recent applications have concentrated on their use as drug delivery vehicles due to the ability of incorporating water-soluble materials in their aqueous volume or oil soluble materials in the lipid bilayer e.g. Ambibiosome(Reg trade mark), an antifungal drug [3-5]. Liposomes can be designed for specific applications through control of the lipid composition or modification of the surface by conjugation of antibodies or peptides [6-8]. For example, cationic liposomes are used in gene therapy applications due to their ability to complex to DNA [9,10].
The fate of intravenously injected liposomes is determined by a number of properties. Two of the most important are particle size and zeta potential. The sites of action of liposome - cell interactions in the body are largely determined by size. Small liposomes can pass through the fenestrae of the liver sinusoids. Intermediate size liposomes are retained within the blood compartment and can circulate for long periods. Larger liposomes are rapidly removed by the Kupffer cells. Both of these parameters can be measured on the Zetasizer Nano range of instruments. Particle size is measured using dynamic light scattering (DLS). This technique measures the time-dependent fluctuations in the intensity of scattered light which occur because the particles are undergoing Brownian motion. Analysis of these intensity fluctuations enables the determination of the diffusion coefficients of the particles which are converted into a size distribution.
The zeta potential of a particle is the overall charge that the particle acquires in a particular medium. Knowledge of the zeta potential of a liposome preparation can help to predict the fate of the liposomes in vivo.In gene therapy, zeta potential can be used to optimize the ratio of liposome to DNA plasmid, to minimise aggregation. Measurement of the zeta potential of samples in the Zetasizer Nano is done using the technique of laser Doppler velocimetry. Further information on this technique can be found in application and technical notes on the Malvern Instruments website.
This application note summarizes size and zeta potential measurements made on both anionic and cationic liposomes.
Liposomes were prepared by the sonication method [1]. A series of anionic liposomes were prepared from various mixtures of dipalmitoylphosphatidylcholine (DPPC) and dipalmitoyl-phosphatidylglycerol in phosphate buffered saline (PBS) as detailed in table 1. Cationic liposomes were prepared from DPPC, cholesterol and the cationic surfactant dimethyl dioctadecylammonium bromide (DDAB) as summarized in table 2. In all cases the final concentrations of the liposomes were 4mg lipid/ml PBS.
| DPPC (mg) | DPPG (mg) | DPPG (mole %) | PBS (ml) |
|---|---|---|---|
| 19 | 1 | 5.2 | 5 |
| 18 | 2 | 10.9 | 5 |
| 17 | 3 | 17.4 | 5 |
| 16 | 4 | 24.6 | 5 |
| 15 | 5 | 32.8 | 5 |
| DPPC (mg) | Cholesterol (mg) | DDAB (mg) | DDAB (mole %) | PBS (ml) |
|---|---|---|---|---|
| 17 | 2 | 1 | 5.6 | 5 |
| 16 | 2 | 2 | 11.8 | 5 |
| 15 | 2 | 3 | 18.6 | 5 |
| 14 | 2 | 4 | 26.1 | 5 |
| 13 | 2 | 5 | 34.6 | 5 |
The lipids were dissolved and mixed in chloroform (DPPG was dissolved in a mixture of chloroform/methanol (2:1 v/v)) and the solvent removed by rotary evaporation at 60°C to obtain a thin lipid film. The appropriate volume of phosphate buffered saline (preheated at 60°C) was added and the vessel vigorously agitated on a rotary mixer to produce multilamellar vesicles (MLVs). The MLVs were then bath sonicated at 60°C for 15 minutes to produce unilamellar liposomes. After sonication, the liposome samples were incubated at 60°C for 15 minutes to allow them to anneal [1].
All sizing and zeta potential measurements were made on a Zetasizer Nano ZS at 25°C. Sizing measurements were made on the neat liposome samples, whereas the samples were diluted 1 in 10 with PBS for the zeta potential measurements. The Nano ZS incorporates non-invasive backscatter (NIBS™) optics for sizing measurements. The detection angle of 173°enables size measurements of concentrated, turbid samples to be made. However, the scattered light detected from samples during a zeta potential measurement is made at the forward angle of 12°. Therefore the laser beam needs to penetrate the sample and as a consequence, the sample concentration for zeta potential measurements must be lower than that for sizing.
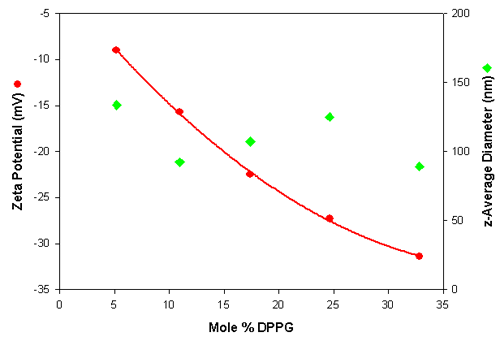
The results of the particle sizing and zeta potential measurements of the various anionic liposomes are summarized in table 3. This table shows the z-average diameters (the mean diameters based upon the intensity of scattered light), the polydispersity index (an estimate of the width of the distribution) and the mean zeta potential values obtained for the various liposome samples. The z-average diameter values are the means of 3 repeat measurements (standard deviations in brackets) made on the neat liposome samples. The zeta potential values are the means of 5 repeat measurements (standard deviations in brackets) made on diluted samples (1 in 10 with PBS).
| Mole % DPPG | z-Average Diameter in nm (SD) | Polydispersity (SD) | Zeta Potential in mV (SD) |
|---|---|---|---|
| 5.2 | 133.8 (0.4) | 0.292 (0.03) | -9.0 (0.64) |
| 10.9 | 92.3 (0.49) | 0.269 (0.01) | -15.7 (1.36) |
| 17.4 | 107.2 (0.20) | 0.256 (0.01) | -22.5 (0.95) |
| 24.6 | 125.1 (0.60) | 0.261 (0.01) | -27.3 (1.29) |
| 32.8 | 89.2 (1.39) | 0.264 (0.01) | -31.4 (0.98) |
The sizing results obtained for these anionic liposome preparations show that the bath sonication method of preparation gives similar size means and distribution widths.
The zeta potential and size values are plotted in figure 1 as a function of the mole% DPPG. The data shows that the measurements are very repeatable for each liposome sample and show the expected trend of becoming more negatively charged with increasing DPPG content. In addition, the results show that the size is independent of the liposome composition.
|
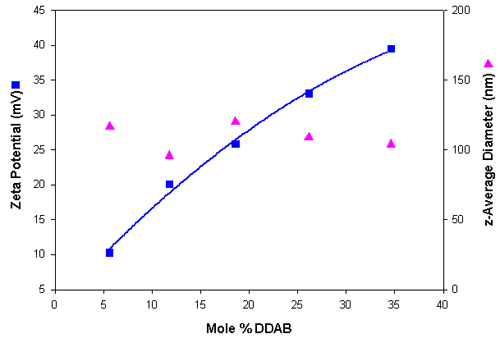
Table 4 summarizes the sizing and zeta potential results obtained for the series of cationic liposomes. Similar size distributions were obtained compared to the anionic liposome preparations. Figure 2 shows a plot of the zeta potential and size results obtained as a function of the mole% DDAB and shows a gradual increase in positive charge as the DDAB content of the liposomes increases.
|
| Mole % DDAB | z-Average Diameter in nm (SD) | Polydispersity (SD) | Zeta Potential in mV (SD) |
|---|---|---|---|
| 5.6 | 116.6 (1.0) | 0.258 (0.01) | 10.3 (0.88) |
| 11.8 | 95.8 (0.36) | 0.223 (0.01) | 20.1 (1.36) |
| 18.6 | 120.3 (0.40) | 0.266 (0.01) | 25.9 (0.52) |
| 26.1 | 109.0 (1.15) | 0.270 (0.01) | 33.1 (2.2) |
| 34.6 | 104.0 (0.42) | 0.251 (0.01) | 39.5 (1.2) |
The physical characterization of liposomes is of great importance in understanding their suitability for a range of applications. Knowledge of the zeta potential of a liposome preparation can help to predict the fate of the liposomes in vivo. Association of charged liposomes with oppositely charged molecules can be monitored by measuring the zeta potential of the resulting complex.
The Zetasizer Nano series enables the rapid and repeatable characterization of both size and zeta potential of liposomes as detailed in this application note.
[1] New, R.R.C. (1992) in Liposomes: A Practical Approach, IRL Press, Oxford, UK.
[2] Bangham, A.D., Hill, A.W. and Miller, N.G.A. (1974) in Methods in Membrane Biology, vol. 1, pp 1-68, Plenum Press, New York.
[3] Schmidt, K.H. (ed.) (1986) in Liposomes as Drug Carriers, Verlag, Stuttgart and New York.
[4] Knight, G. (ed.) (1981) in Liposomes: From Physical Structure to Therapeutic Applications, Elsevier/North Holland Biomedical Press, Amsterdam.
[5] Gregoriadis, G. (1988) in Liposomes as Drug Carriers: Recent Trends and Progress, John Wiley and Sons, Chichester, UK.
[6] Hutchinson, F.J., Francis, S.E., Lyle, I.G. and Jones, M.N. (1989) Biochim. Biophys. Acta 978, 17-24.
[7] Jones, M.N. and Kaszuba, M. (1994) Biochim. Biophys. Acta 1193, 48-54.
[8] Kaszuba, M., Lyle, I.G. and Jones, M.N. (1995) Colloids and Surfaces 4, 151-158.
[9] Pedroso De Lima, M.C., Simoes, S., Pires, S. Faneca, H. and Duzgunes, N. (2001) Adv. Drug Deliv. Rev. 47, 277-294.
[10] Eastman, S.J., Siegel, C., Tousignant, J., Smith, A.E., Cheng, S.H. and Scheule, R.K. (1997) Biochim. Biophys. Acta 1325, 41-62.