This application note describes the texture analysis of a rolled copper specimen. The experimental data were measured on an X’Pert3 diffraction system equipped with a texture cradle.
In polycrystalline solid materials, such as a wide class of metals and ceramics, usually the orientation of the crystallites, constituting the material, is not distributed randomly, like in an
ideal powder specimen. In most cases a preferred orientation of the crystallites with respect to the sample reference frame is present. In materials science this preferred orientation is referred to as texture.
In polycrystalline solid materials, such as a wide class of metals and ceramics, usually the orientation of the crystallites, constituting the material, is not distributed randomly, like in an ideal powder specimen. In most cases a preferred orientation of the crystallites with respect to the sample reference frame is present. In materials science this preferred orientation is referred to as texture. Intrinsic properties of crystalline materials are in almost all cases dependent on the direction in the crystal reference frame. Macroscopic properties of a certain sample can be determined from the material properties, thereby taking into account the orientation of each of the crystallites in the sample. In general it is not possible to account for each individual crystallite; in these cases the orientation distribution function (ODF) is used to average the properties over all the crystallite orientations in the sample. The ODF describes the volume fraction of the crystallites that have a certain orientation with respect to the sample reference frame. More information on texture analysis can be found in the text books of Bunge and Esling (Bunge and Esling, 1991) and of Kocks et al. (Kocks, Tomé and Wenk, 1998). This application note describes the determination of the ODF using X-ray diffraction methods. The process is illustrated with the use of a rolled copper specimen.
In X-ray diffraction texture analysis, the ODF is determined from a set of pole figures. In a pole figure measurement according to the Schulz reflection technique (Schulz, 1949), the intensity of a single (hkl) reflection is measured as a function of the sample orientation. The orientation of the sample is varied by changing the tilt of the sample along the χ-axis and by the rotation around the sample surface normal (φ). In this way the orientation of one specific crystal direction is measured. A full representation of the texture over all crystal directions is given by the ODF, which can be calculated from a set of experimentally determined pole figures. The ODF is then used to (re)calculate pole figures and inverse pole-figures. Pole figures give information on the distribution of one specific crystal direction over all possible sample orientations. Inverse pole figures contain information on the orientations of the crystallites in one specific sample direction.
This application note describes the texture analysis of a rolled copper specimen. The experimental data were measured on a multi-purpose X-ray diffraction system equipped with a texture cradle. These experiments can be performed on X’Pert3 MRD or Empyrean sytems, equipped with a multiple- axes cradle. For the analysis of the data, our analytical software X’Pert Texture was used. Additional information from the pole figures is used to correct peak intensities for texture in standard phase analysis.
Almost all physical properties of crystalline materials are strongly dependent on the crystal orientation. In practice, the most commonly used artificial and natural solid materials are polycrystalline and have a non- random orientation distribution of the crystallites. These distributions are called preferred orientations or texture. In order to describe macroscopic properties of polycrystalline materials, the materials properties, the size and the orientation distribution of the crystallites must be known. This shows that texture analysis is not a goal in itself; it gives the information that is required to understand the macroscopic chemical, physical or mechanical properties of solid materials. X-ray diffraction is a widely used technique to determine preferred orientations. Orientation distribution functions of worked pieces of material can be obtained from a set of measured pole figures. X-ray diffraction texture analysis is therefore an indispensable technique for the materials scientist.
Figure 1. Schematic representation of the experimental setup of a texture measurement in the Schulz geometry, employing an incident beam collimator and a programmable receiving slit
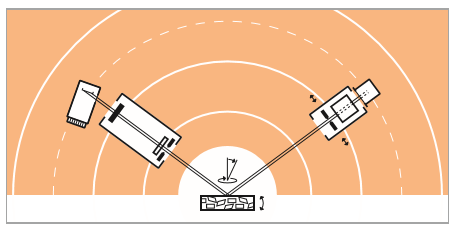
Texture measurements were performed on a rolled copper disc with a diameter of 22 mm and a thickness of 0.8 mm. The sample was mounted on an X-ray diffraction system equipped with a multiple-axes cradle. Four pole figures - (111), (200), (220) and (311) - were measured according to the Schulz reflection method. A schematic representation of the experimental setup is shown in Figure 1. Background intensities were measured next to the diffraction peaks with an offset in 2θ of ±4°. To correct for defocusing effects due to sample tilt, two methods can be applied. One method uses experimental correction curves, measured on a texture-free copper ‘powder’ sample under the same experimental conditions as the rolled copper sample. Alternatively, the defocusing curve can be calculated (Gale and Griffiths, 1960, Huijser-Gerits and Rieck, 1974). For these calculations, knowledge of the full width at half maximum (FWHM) of the reflections at a zero χ-tilt is required. This information can be obtained from a θ-2θ scan, measured on the textured sample. X’Pert Texture, a software program for quantitative X-ray texture analysis, is used for the analysis and visualization of the texture data.
Firstly, the experimental pole figures are corrected for background intensities as measured on the textured samples. Secondly, the defocusing correction is applied either with the use of an experimental or a calculated defocusing curve.
A comparison of these two curves for the Cu (220) pole figure is shown in Figure 2. The data are normalized with respect to the intensity at χ=0°. A good agreement between the measured and the calculated defocusing curves is revealed. This shows that the measurement geometry, on which Gale and Griffiths’ model is based, gives a good description of the experimental conditions in PANalytical’s diffractometers.
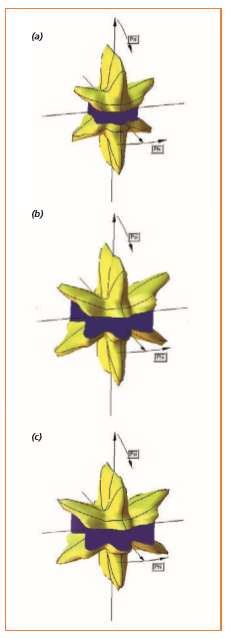
Figure 3 shows a 3D representation of the Cu (220) pole figure (a) as measured and (b) as corrected. The blue band in the pole figures indicates the non-measured areas above χ=75°. It is observed that the effect of the defocusing correction is most pronounced for the higher χ-tilt angles.
Figure 2. Measured and calculated defocusing corrections for the Cu(220) pole figure
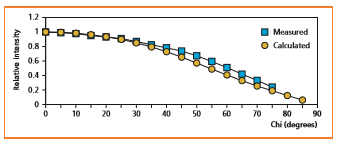
Figure 3. (a) The measured Cu(220) pole figure (b) The corrected Cu(220) pole figure (c) The calculated Cu(220) pole figure
X’Pert Texture calculates the ODF according to an iterative method for ODF reconstruction, the so-called WIMV (Williams-Imhof-Matthies-Vinel) method (Imhof 1981, Matthies and Vinel, 1979). In Figure 4 the ODF derived from the rolled copper in a cubic-orthorhombic setting is shown in 2D representation. The R-value for these calculations was 7.9%.
When the ODF data are available X’Pert Texture can calculate pole figures and inverse pole figures for any integer set of (hkl) values (with h, k and l smaller than 100) and any real set of (xyz) co- ordinates (with x, y and z smaller than 100). The user can define the maximum value of χ to be calculated. Normally, pole figures are calculated up to 90°. Alternatively, the maximum χ value from the experimental pole-figures can be used to simplify comparison between measured (or corrected) and calculated pole figures. In Figure 3c the calculated Cu (220) pole figure is shown. The original pole figure was measured up to a χ-tilt angle of 75°. To facilitate comparison the χ-limit for the calculated pole figure was set to 75° as well. The calculated pole figure shows a close resemblance with the corrected one (Figure 3b), which confirms the consistent quality of the initial measurements.
An additional feature of Texture is the evaluation of texture data with the use of K-factors and normalization factors. The K-factor is defined as the ratio of the intensity in a (raw, corrected or calculated) pole figure at χ = 0° to the average intensity over the total pole figure (Kogan and Bethke, 1997). K-factors can be used to convert intensities, measured on a textured sample, to ‘random’ powder intensities, which would be measured on a texture- free sample. With K-factors, you can correct intensities for e.g. qualitative or quantitative phase analysis.
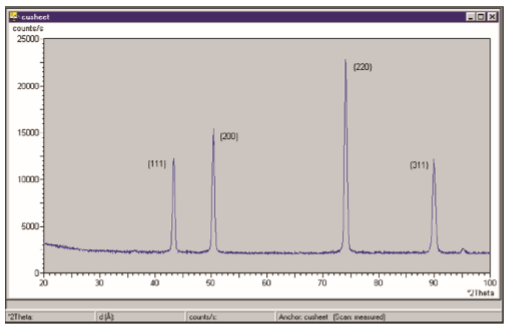
To correct the intensities of peaks measured with a θ-2θ scan on a textured sample, the measured intensity should be divided by the K-factor. An example of the use of K-factors is given for rolled copper. From a θ-2θ scan, shown in Figure 5, the absolute and relative intensities of four reflections have been derived. They are shown in the the second and third column of Table 1, respectively. In the fourth column the K-factors as obtained from corrected pole figures, measured under the same conditions as the θ-2θ scan are given. These K-factors are used to correct the intensities from the second column for the texture. The results of this are shown after normalization to the strongest intensity in the fifth column. The normalization factor is defined as the total intensity of a pole figure, averaged by area. Normalization factors of a set of pole figures (hkl’s) can be compared with the relative intensities present in a ‘powder pattern’ (e.g. an ICDD (International Centre for Diffraction Data) reference pattern). For that purpose the relative normalization factor (normalization factor (%) with the strongest line = 100%) must be calculated. In the table below the absolute and relative normalization factors as derived directly from the corrected pole figures are given in the sixth and seventh columns.
Figure 4. 2D representation of the ODF of the rolled copper specimen. The ODF is shown in the Bunge notation with Phi1 as fixed axis; the Phi1 step size is 5 degrees.
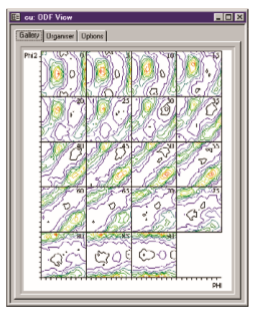
Table 1. Normalization and K-factors as calculated from the texture measurements on the rolled copper specimen * ICDD Reference pattern, PDF No. 04-0836 (Copper).
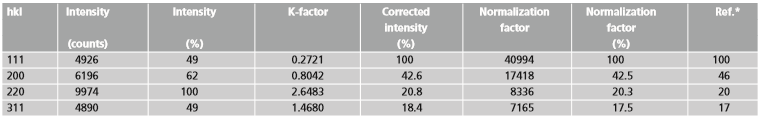
It is shown that the normalization factors are in good accordance with the corrected intensities derived from the K-factors. Moreover, both these results show also a good agreement with the relative intensities as are given on the ICDD reference pattern for copper, PDF No 04-0836 (last column). It should be noticed that the most realistic normalization and K-factors result either from pole figures (re-) calculated up to 90° from an ODF or from corrected pole figures, measured up to χ = 70 or 75°. In the first case, it is sufficient to measure only a few pole figures, and to calculate the ODF and the necessary pole figures subsequently. In the latter case, no ODF calculation is necessary but all pole figures need to be measured.
Figure 5. θ-2θ scan of the rolled copper specimen measured with the same experimental conditions as the pole figures. The peak intensities are given in Table 1. The FWHM of the peaks is used to calculate the defocusing curve.
X-ray diffraction is used for the analysis of texture in a rolled copper specimen. The pole figures as recalculated from the ODF reveal a close resemblance with the corrected pole figures corrected for background intensities and defocusing effects. A good match between corrected and recalculated data confirms the consistent quality of the initial, experimental data.
Additional information, as can directly be derived from pole figure data, is used to correct X-ray diffraction data for texture influences. The experimental data corrected with the use of K-factors and normalization factors are in good accordance with the ICDD data.