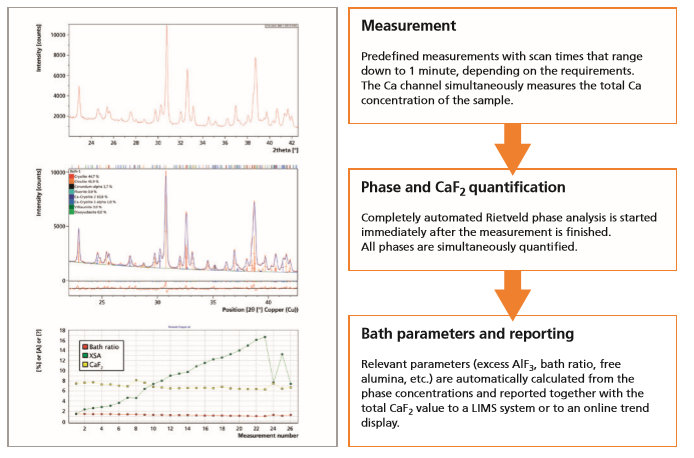
The production of aluminium from purified alumina by electrolysis (Hall-Héroult process) is a very energy-consuming process. Continuous monitoring of the bath composition is of paramount importance in order to determine, adjust and maintain the optimal bath composition which results in significant energy and cost savings.
X-ray diffraction (XRD) in combination with a Rietveld quantification is the optimal technique for the analysis of electrolytic baths. It provides the true phase concentrations in addition to common bath parameters like bath ratio and excess AlF3 (XSA) as well as CaF2 or free alumina content.
The production of aluminium from purified alumina by electrolysis (Hall-Héroult process) is a very energy-consuming process. Continuous monitoring of the bath composition is of paramount importance in order to determine, adjust and maintain the optimal bath composition which results in significant energy and cost savings.
X-ray diffraction (XRD) in combination with a Rietveld quantification is the optimal technique for the analysis of electrolytic baths. It provides the true phase concentrations in addition to common bath parameters like bath ratio and excess AlF3 (XSA) as well as CaF2 or free alumina content. Additionally, unlike traditional calibration-based XRD approaches it does not require standards anymore. It can be applied on different types of electrolytic baths (addition of Ca, Mg[1], Li[1], K). XRD can also be used to analyze the raw materials such as bauxite (please see dedicated application note[2]) and refined alumina and check the quality (crystallinity) of the carbon anodes used in the Hall-Hérault process.
Quantitative Rietveld phase analysis is based on a least-squares fitting approach (‘refinement’) where the whole diffraction pattern is calculated using crystal structure data of the expected phases and physical parameters. All phases (quantity and properties) and instrumental influences are taken into account simultaneously. Variations in the sample preparation are corrected during the refinement and do not effect the results. The procedure is standardless and allows phase quantification down to approximately 0.5 wt.%. All relevant process parameters (e.g. bath ratio, excess AlF3) are directly calculated from the phase concentrations.
Figure 1: Principle of a Rietveld quantification shown for a typical electrolythic bath sample. The red line is the actual measurement, the blue line is the calculated profile from the Rietveld routine.
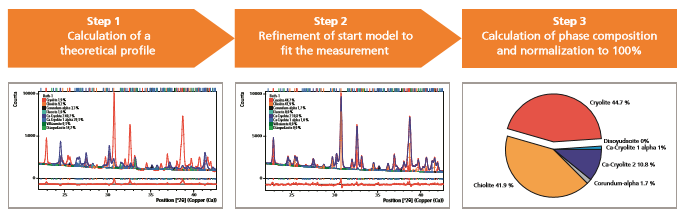
The refinement procedure as well as the subsequent calculations are run as fully automated routines in HighScore 4.x with the Plus option and Roboriet 4.x.
Hardware
Software
To demonstrate the versatility and accuracy of the Rietveld- based analysis approach, different electrolytic bath types were analyzed. In addition, examples for the analyses of alumina and of the carbon anodes are shown. All these tasks can be completely automated similar to the electrolytic bath analysis.
No expensive sample preparation is required for X-ray diffraction. The samples must be ground and pressed in steel rings or aluminium cups. No chemicals are required. The following analyses were performed:
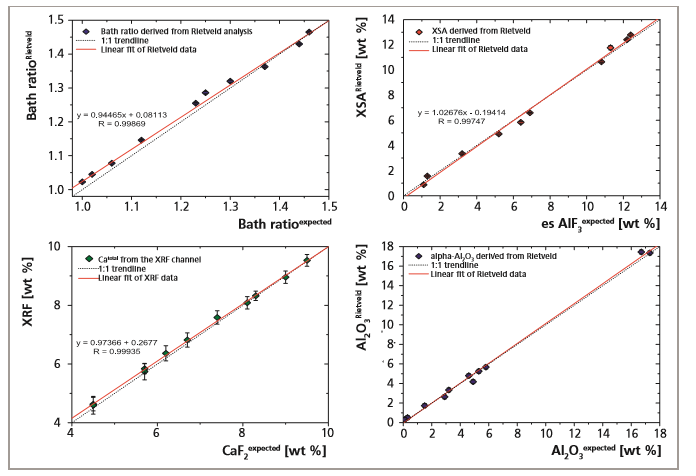
Standard electrolytic baths typically consist of cryolite (Na3AlF6), chiolite (Na5Al3F14), Ca-cryolites (Na2Ca3AlF14, NaCaAlF6, NaCaAl2F9), fluorite (CaF2), villiaumite (NaF), diaoyudaoite (‘beta’, NaAl11O17) as well as α-alumina (Al2O3). From the concentrations of these phases, Figure 2, the relevant bath parameters (excess AlF3, bath ratio, total CaF2) are directly calculated.
The 11 standards analyzed in this study (reference materials available from Alcan) are commonly used standards for the classical calibration-based quantification. They were selected to validate the Rietveld-based bath analysis and to compare the bath parameters excess AlF3, α-alumina, bath ratio as well as CaF2 content.
Figure 2. Example of a typical Rietveld refinement obtained from a Ca-rich electrolytic bath (Alcan reference BA-7)
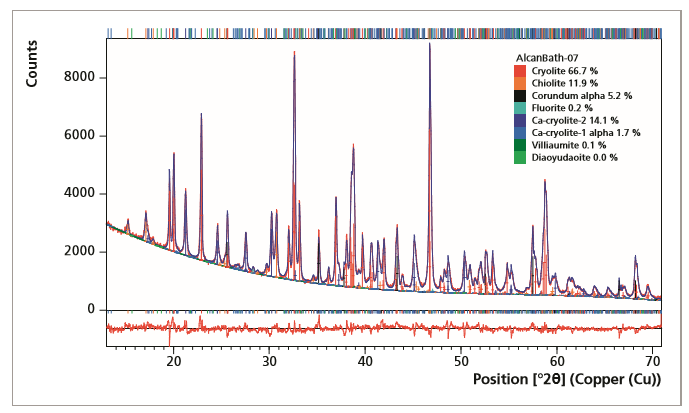
Table 1. Expected versus calculated process parameters from Rietveld phase quantifications including the estimated standard deviation (esd, calculated as 3σ) from 12 individual analyses per standard bath sample
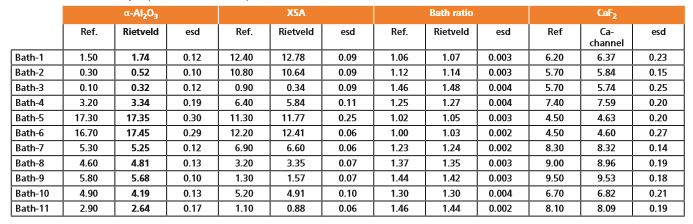
Table 1 and Figure 3 demonstrate that the process parameters calculated from the actual phase concentrations are in very good agreement with the reference values obtained by wet- chemistry. Small deviations between the Rietveld and the wet chemical results can be explained with the analytical errors of both methods. Usual deviations of wet-chemical analysis are in the region of 0.2 - 0.4 wt.% for excess AlF3 (XSA). Low estimated standard deviations calculated from 12 individual analyses per sample proof the reproducibility of the determination of process parameters from the Rietveld quantification
The results clearly show that Rietveld full pattern analysis is a fast (scan time is about 1 minute per sample) and reliable approach to simultaneously determine both the phase concentrations and bath parameters for process control. All bath compositions (bath ratios from 0.9 to 1.5) are covered by the same routine and all phases (Ca-cryolites) are taken into account. This differs from the classical approach.
Figure 3. Process parameters bath ratio, excess AlF3 (XSA), CaF2 as well as α-Al2O3 calculated from the phase quantities. Error bars represent the estimated standard deviation (3σ).
Typically the bath analysis in a smelter plant has to cover a large range of bath compositions. Bath ratios can vary from 0.9 to 1.5. During the start-up procedure of baths the composition (very low or high bath ratios) is usually very different from the desired target value (medium bath ratios). The composition and operating conditions are slowly adjusted until the optimum range is reached. Since this start-up process must be closely monitored, it is essential that the applied method can accurately cover all possible phase concentrations.
Figure 4. Bath ratio and excess AlF3 (XSA) derived from the automatic Rietveld analysis versus expected values and corresponding examples of Rietveld refinement plots of a low and high bath ratio sample
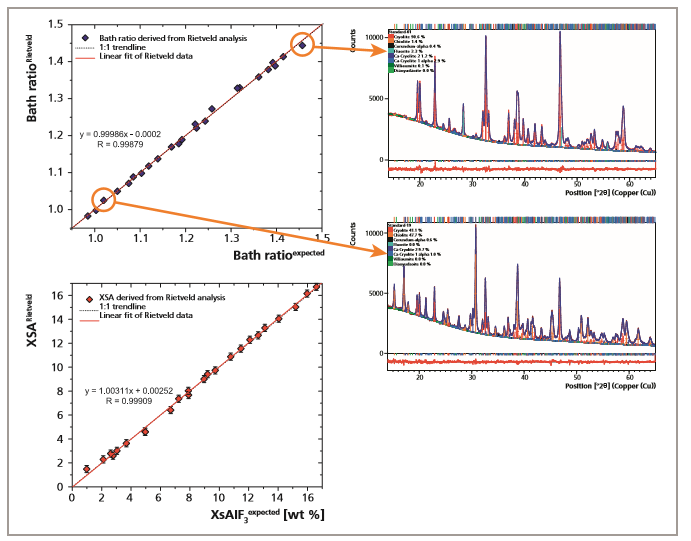
The results obtained by the Rietveld quantification from 25 real production samples, show a very good correlation with independently determined reference values for the electrolytic baths, Figure 4. This approach covers all bath ranges using only one analysis routine. Traditionally, the same type of analysis required 3 independent calibration lines for low, medium and high bath ratios to cover the same compositional range.
The resulting accuracy for the excess AlF3 and the bath ratio is < ± 0.2 wt.% and < ± 0.01, respectively, over the whole range allowing a very precise determination and monitoring of bath properties. Not only the bath parameters can be monitored but simultaneously the phases, providing additional important information about the status of the baths, which cannot be provided by other techniques
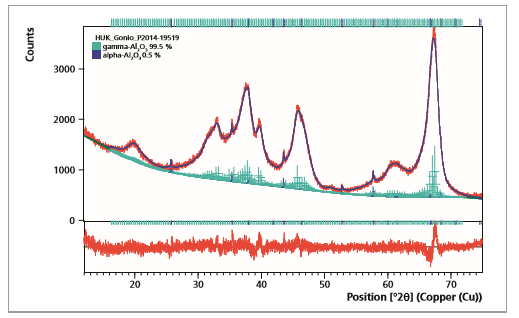
In addition to electrolytic bath analysis, X-ray diffraction offers the possibility to analyze Al2O3 modifications in alumina samples. The knowledge of the different modifications is important to predict and optimize the behavior during the smelting process. γ-Al2O3 is desired for the electrolysis due to the fact that it dissolves more easily during the smelting process than α-Al2O3. For that reason the ratio of the different sub-α and α-Al2O3 modifications of alumina must be monitored.
The analysis of α-Al2O3 can be done with a classical straight line calibration of the α-Al2O3 peaks or using full pattern fitting methods. Advantage of using the full information of the XRD pattern is the simultaneous quantification of all sub- α-Al2O3 modifications. The analysis of the sample in Figure 5 was done using the PONKCS method (partially or not known crystal structure; Scarlett & Madsen, 2006). It allows the fitting and quantification of amorphous or low crystalline materials. Even a small fraction of 0.5 wt.% α-Al2O3 can be detected and quantified.
Figure 5. γ-Al2O3/α-Al2O3 quantification using the Rietveld method and a PONKCS model for the γ-Al2O3-phase
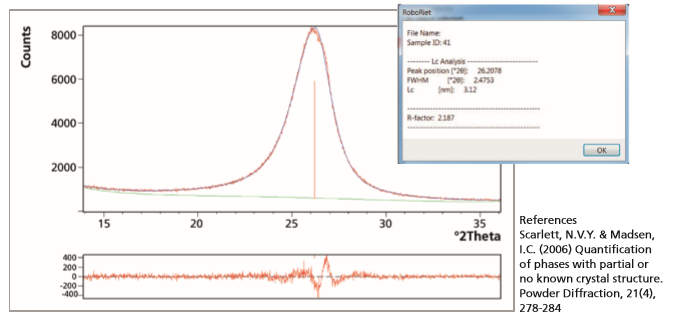
X-ray diffraction can also be used to monitor the quality of the graphite anodes used in the electrolytic baths. These anodes are consumed in the process and are replaced on a regular basis. The respective lifetime of an anode is mainly controlled by the average crystallite size (Lc) of the graphite platelets as well as contaminations (e.g. Na, S). The ASTM standard test method for the determination of the crystallite size (ASTM D5187) is included in PANalytical’s solution for electrolytic bath analysis. Figure 6 shows an example of the analysis of the crystallite size Lc of a graphite anode, resulting in an average crystallite size of 31 Å.
Figure 6. Example of the analysis of the crystallite size Lc of a graphite anode
The presented results demonstrate that X-ray diffraction in combination with Rietveld full pattern analysis
No standards, intensity monitors and recalibrations are required anymore.