
The Morphologi® ID can be used to compare material and chemical properties of Active Pharmaceutical Ingredients (APIs) in a drug product using Morphologically-Directed Raman Spectroscopy (MDRS®). Characterizing these properties is an important stage in formulation development, Quality Control and supporting in-vitro bioequivalence studies for ANDA submission. Here, we apply this technology to a comparison of innovator and generic versions of an oral solid dose pharmaceutical product containing two APIs.
A generic drug is defined as being "identical or bioequivalent to a brand name drug"1. Generic is also a term applied to a drug marketed under its chemical name alone without any advertising, such as when a patent expires but a drug company wishes to continue to sell a product as a generic version. Generic drugs approved by the U.S. Food and Drug Administration (FDA) need to meet the same rigid standards as the innovator drug. It must:
In 1984 the U.S. Drug Price Competition and Patent Term Restoration Act standardized the procedure for generic drug recognition. An applicant files an Abbreviated New Drug Application (ANDA) and has to demonstrate to a specified, previously approved "reference listed drug"2. Once an ANDA is approved, the FDA adds the drug to the Approved Drug Products list also known as the "Orange Book" which shows the link between the generic and the reference listed drug (innovator).
In order to show that a generic drug is bioequivalent to an innovator drug it must display comparable bioavailability when studied under similar experimental conditions3. Bioavailability is the rate and extent to which the active ingredient is absorbed from a drug product and become available at the site of drug action and bioequivalence refers to equivalent release of the same drug substance from two or more drug products or formulations4.
The premise underlying this 1984 law is that bioequivalent products are therapeutically equivalent and, therefore, interchangeable.
Malvern Panalytical received samples of innovator and generic tablets of a dual active pharmaceutical ingredient (API) product. The interest was in investigation of the particle size distribution (PSD) of each of the APIs upon tablet disintegration as this would be expected to have a significant effect on the subsequent bioavailability of the drug.
This application note describes how Morphologically-Directed Raman Spectroscopy (MDRS®), available with the Morphologi® ID, can be applied to chemically identify and isolate particles of interest within a formulation. This enables component-specific particle size distributions to be obtained.
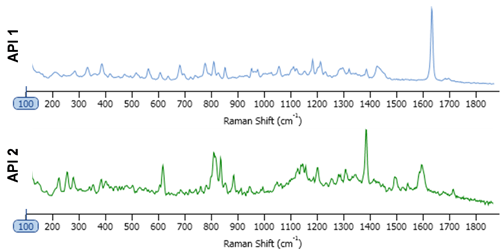
The tablets provided contained the same dosage for the two APIs. Both of which were practically insoluble in water. This was therefore used as the dissolution/disintegration media, with the presumption being that the API particles would remain mostly undissolved. One tablet of each (generic and innovator) was dissolved in 100 ml of water. 2 ml was sub-sampled and diluted with a further 20 ml of water. 2 ml of this suspension was pipetted onto an aluminum coated microscope slide and allowed to dry overnight. The particle size and shape data were collected and analyzed with automated image analysis, with settings determined and stored as a standard operating procedure. A spectral reference library was created for the sample by taking point spectra of the "pure" components, Figure 1. For this analysis, the size range of interest was between 1 and 10 μm and Raman spectra were acquired from only particles in this size range. The particle spectra were pre-processed to minimize baseline variation then correlated to the spectral reference library. The more similar a particle spectrum is to the library component, the closer the correlation score is to 1. Final particle classification was based on their designated chemical identity and the particle size distribution.
|
Based on an analysis of morphological parameters from the particle image results alone, the two APIs could not be differentiated. The particles were too similar in shape.
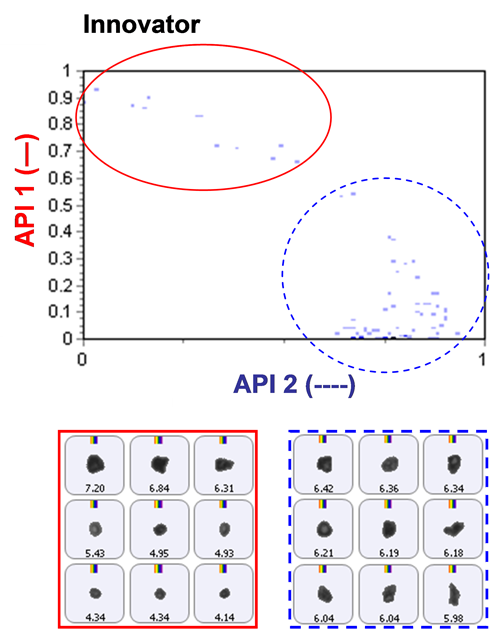
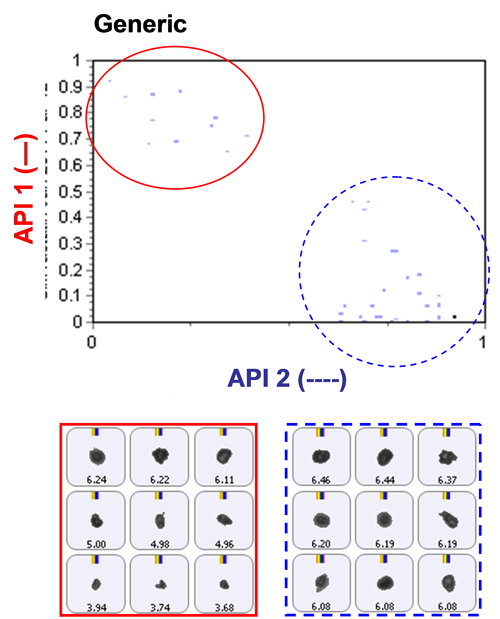
The inclusion of Raman spectroscopic information for chemical identification readily differentiates between the two APIs, as demonstrated in Figure 2. This scattergram plots the correlation scores for the two API components against one another. API 1 and API 2 are clearly separated via the Raman data. Also shown in the figure are example particle images.
|
|
Once the two API populations can be differentiated, it then becomes possible to determine the individual PSDs from the blends.
Figure 3 shows the overlay of the circular equivalent diameter (CED) distribution by number of each API from the chemically defined populations. There appears to be fewer small particles of API 1 in the generic tablet than the innovator tablet. The API 2 PSDs appeared to overlay well for the two different tablets.

|
Figure 4 and Figure 5 show classification charts comparing the two API classes for the two tablet types in percentage count and percentage volume, respectively. The tablets contain equal amounts of each API in their formulations, but the innovator appeared to contain a higher proportion of API 2 compared to API 1 than the generic tablet, for the samples analyzed. A comparison of these in vitro results to in vivo data could provide further information as to whether this observed difference effects the actual bioavailability of the generic drug product and hence its bioequivalence to the innovator product.

|

|
The combination of automated particle imaging and Raman spectroscopy in one instrument allows MDRS to be performed. This allows the individual components present within a blend or mixture to be independently characterized and compared.
Such a tool can be used to gain better product understanding across many areas of the pharmaceutical industry from regulatory to troubleshooting. It is not, however, limited to pharmaceuticals alone and is also applicable to other samples which have Raman spectra.