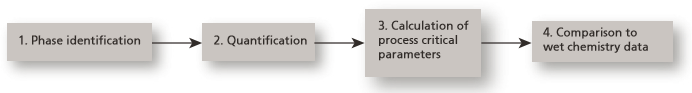
This application note describes the benefits of X-ray diffraction (XRD) to the quantitative determination of the phase content and the calculation of process critical parameters for the production of direct reduced iron (DRI).
Direct reduced iron (DRI), also called sponge iron, is produced by the reduction of iron ore (in the form of lumps, pellets or fines) with a reducing gas produced from natural gas or coal. This process is called direct reduction.
Direct reduced iron (DRI), also called sponge iron, is produced by the reduction of iron ore (in the form of lumps, pellets or fines) with a reducing gas produced from natural gas or coal. This process is called direct reduction.
This application note describes the benefits of X-ray diffraction (XRD) to the quantitative determination of the phase content and the calculation of process critical parameters for the production of direct reduced iron (DRI).
Although XRD initially may require a larger investment, this is rapidly paid back because of more frequent analysis of the production process and no additional laboratory cost.
The quality control of DRI is possible by using modern XRD methods. Process critical parameters are calculated from the mineralogical phase content. In addition to the process-critical parameters, metallic iron content (Femet), metallization (Metn) and the total carbon content (Ctot), XRD analysis also identifies the overall mineralogical phase content and the quantity of all phases present in a sample.
DRI samples contain metallic iron as well as other iron-containing phases such as hematite, magnetite, cohenite, wuestite and fayalite. Knowing the qualitative and quantitative phase content means additional information about the reduction process and an optimal raw material mixture.
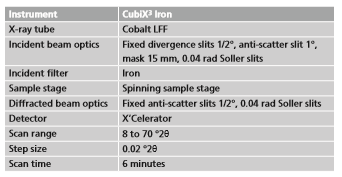
The measurements were made using a CubiX3 Iron industrial diffractometer, suitable for all types of iron-containing samples (Table 1). A cobalt tube with incident beta filter (Fe) is especially suited for iron-containing materials, as it produces high-resolution data without creating excessive sample fluorescence. The measurements can be done in 6 minutes using a high-speed X’Celerator detector
Table 1. Configuration and measurement conditions
Most of the time the grain size of DRI samples is too large for direct analysis. Samples, therefore, have to be milled and pressed with a compact sample preparation machine into steel ring sample holders. Sample handling and preparation are critically important for a reliable phase quantification. It is recommended that a standardized or automated sample preparation procedure is used.
The analysis of the data was done with HighScore Plus in combination with the reference database PDF-4+. This combination uniquely supports all analysis steps as described in this application note (phase identification, quantification, and the calculation of process critical parameters), and can be fully automated for use in an industrial environment.
It will be demonstrated that the process critical parameters as previously determined by wet chemistry, are exactly reproduced in a fully automated fashion, with extensive labor by expert chemists. Additionaly, a full overview of the phases in the material is obtained, for an even better understanding and control of the process.
The mineral and metal phases in the DRI samples were identified by means of XRD. XRD is one of the few techniques that can distinguish between the phases and determine
their amounts. For this case study 10 samples (A-K), sampled during the production of DRI in a steel plant, were analyzed. After identification of all crystalline phases the quantitative phase content was determined using the full pattern Rietveld method.
Seven different phases were present in the samples:
Results are shown in Figure 1.
Figure 1. Phase identification of sample K (direct reduced iron) with the intensity in square root scale
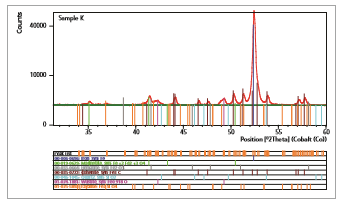
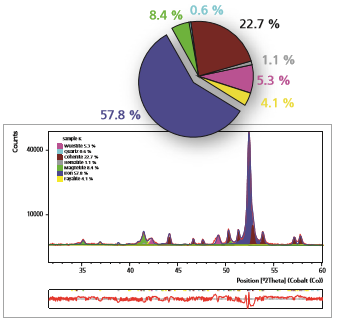
Figure 2 shows the quantification of all crystalline phases of one DRI sample. The analysis is based on the full diffraction pattern. The different peak positions identify different phases. From the intensities the quantitative content is calculated.
Rietveld refinement in combination with high-speed data collection allows for fast and reliable quantification. The full pattern Rietveld method has several advantages compared to classical quantification methods. All crystalline phases can be quantified in just a few seconds. Line overlaps, sample height and preferred orientation do not influence the results. Additionally, no standards, monitors or calibrations are needed.
Figure 2. Rietveld quantification of sample K (direct reduced iron) with the intensity in square root scale
The phase content was then used to calculate process-critical parameters such as metallic iron (Femet), total iron (Fetot), metallization (Metn) and the total carbon (Ctot) content.
Metallic iron (Femet) can be calculated from the iron content in cohenite (Fe3C) and metallic iron. Total iron (Fetot) is the sum of elementary iron from all iron containing phases. Metallization (Metn) describes the ratio between Femet and Fetot in percentage. The carbon content Ctot is calculated from the amount of cohenite in the samples.
Table 2. Phase concentrations
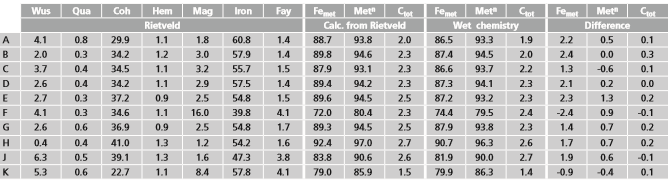
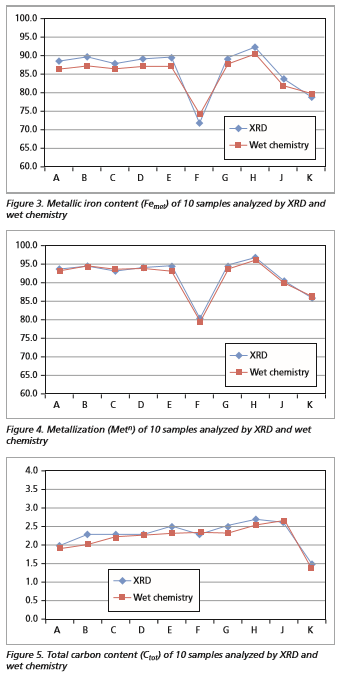
Table 2 shows the results of all 10 analyzed samples. Phase concentrations are converted to Femet, Metn and Ctot. The data from wet chemistry, those calculated with XRD and the calculated difference between these two methods are shown in the last three columns of Table 2, as also displayed graphically in Figures 3 - 5 on page 4. These data show a strong correlation of Metn and Ctot between XRD and wet chemistry.
In addition, the Femet content shows a systematic difference of 2% based on the different analytical methods. The results clearly show that XRD is a fast, accurate and precise method to determine process critical parameters for the production of DRI.
Rapid XRD analysis offers a reliable method to determine process critical parameters such as metallic iron (Femet), total iron (Fetot), metallization (Metn) and the total carbon (Ctot) content within minutes. In addition, the mineralogical phase composition of direct reduced iron provides information about the efficiency of the reduction process and for optimizing the raw material mixture.
A reproducible sample preparation is crucial for analyzing direct reduced iron samples. This can be achieved by automated sample preparation equipment.
The use of XRD with its modern optics, high-speed detectors and software provides rapid and accurate mineral analysis. XRD is suitable for process control environments, increasing operational efficiency.