
In this data sheet it is shown that the Epsilon 1 is a fast and accurate solution for this application. Furthermore the X-ray fluorescence (XRF) instrument can be installed inside the factory close to the production facilities to create a fast feedback loop.
In the paper industry silicon is coated on paper to create a non-sticking release layer, which is used for applications such as tape and backing paper. It is essential to control the amount of silicon during the production process, where insufficient silicon lowers the quality of the end product, and too much adds extra costs to the production process. Therefore ideally a fast analyzer can be used to monitor the silicon concentration during the production process.
In the paper industry silicon is coated on paper to create a non-sticking release layer, which is used for applications such as tape and backing paper. It is essential to control the amount of silicon during the production process, where insufficient silicon lowers the quality of the end product, and too much adds extra costs to the production process. Therefore ideally a fast analyzer can be used to monitor the silicon concentration during the production process. In this data sheet it is shown that the Epsilon 1 is a fast and accurate solution for this application. Furthermore the X-ray fluorescence (XRF) instrument can be installed inside the factory close to the production facilities to create a fast feedback loop.
Measurements were performed using an Epsilon 1 EDXRF spectrometer, equipped with a 50 kV silver-anode X-ray tube, 6 filters and a high-resolution silicon drift detector (SDD). The data were automatically processed by the Epsilon 1 software.
Eight silicon on paper in-house standards, including a ‘blank’ sample, were used to set up the calibrations for Si. All standards were measured in triplicate. The Si-concentration in the standards ranges between 0.00 g/m2 and 1.85 g/m2. Each paper standard was placed in the sample holder, with an additional plastic insert to keep the standard flat during the measurements.
A single 30 second measurement condition was used to analyze the Si concentration (Table 1). Figure 1 shows the XRF spectra of two standards: the ‘blank’ standard (yellow), and the 1.85 g/m2 Si standard (blue). As shown in the XRF spectrum, the blank standard already contains a significant amount of Si, which is present in the paper. Additionally, the Epsilon 1 can also analyze other elements that are present in the sample, for example Mg, Al, P, S, Cl, Ca and trace metals. However, suitable calibration standards are required for quantifying those elements.
| Element | kV | μA | Medium | Filter | Measurement time (s) |
|---|---|---|---|---|---|
| Si | 10 | 500 | Air | None | 30 |
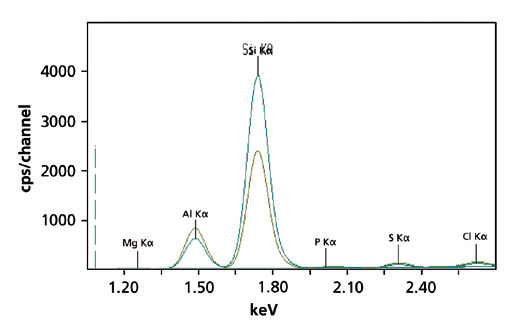
Figure 1. Two XRF spectra of Si on paper standards. Yellow spectrum represents the ‘blank’ standard and the blue spectrum represents the 1.85 g/cm2 Si standard.
Figure 2 shows the calibration graph for silicon on paper. The graph shows a good correlation between the concentrations and the measured intensities. Detailed calibration results are shown in Table 2. The RMS (root mean square) value equals 1 sigma standard deviation. The lower limit of detection (LLD; 3 sigma) was determined on the ‘blank’ standard and is also shown in Table 2. The relatively high RMS could be explained by inhomogeneity of the in-house standards, used to set up the calibration.
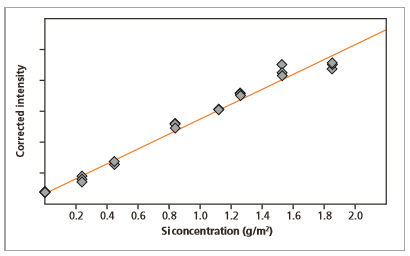
Figure 2. Calibration graph for Si on paper. Each standard was measured in triplicates.
| Element | Concentration range (g/m2) | RMS* (g/m2) | Correlation | LLD (g/m2. 30 s) |
|---|---|---|---|---|
| Si | 0.00 - 1.85 | 0.0859 | 0.9911 | 0.009 |
Detection limit
As shown in Table 2, with a 30 second measurement time and repeated for 20 times at the same ‘blank’ standard, a LLD (3 sigma) was found of 0.009 g/m2. The relatively high LLD value can be related to the presence of Si in the ‘blank’ standard, which can be seen in the yellow spectrum in Figure 1.
To test the instrument precision, a Si on paper standard (1.26 g/m2) was measured 20 times, each with a measurement time of 30 seconds. The average concentration and corresponding RMS value are shown in Table 3. The Si concentration showed a consistent trend with a very small RMS value. The repeatability test for Si on paper is graphically illustrated in Figure 3.
| Element | Average conc. (g/m2) | RMS (g/m2) | Rel .RMS (%) |
|---|---|---|---|
| Si | 1.266 | 0.005 | 0.4 |
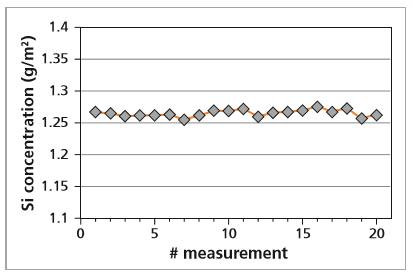
Figure 3. Graphical representation of a repeatability measurement of a 1.26 g/m2 Si standard.
The results clearly demonstrate the excellent capability of Epsilon 1 for a fast analysis of Si on paper. The high performance of the silicon drift detector in the Epsilon 1 make it possible to get accurate and fast results for silicon on paper, in just 30 seconds.
The Epsilon 1 gives the user the opportunity to control the production process close to their production facilities. An extra advantage of the Epsilon 1 is that inexperienced operators can use the apparatus for their daily routine operations with only a few clicks on the touch screen.