
Steel is widely used in our daily lives. It is the basic material used in construction and car manufacturing, as well as household appliances. In order to maintain its properties over a long period of time, high quality is a fundamental requirement. X-ray fluorescence is the technique used for quality control for both bulk analysis and small spot analysis and elemental distribution mapping.
The integration of the ED core into the Zetium spectrometer sees two technologies, namely WD- and EDXRF, converging to make a unique and powerful analytical heart called SumXcore technology, which delivers specific benefits for metals applications, such as:
• Reduced measurement times
• Identification and flagging of unexpected elements in production
• Fast sample screening
• Spectrum archiving
Steel is widely used in our daily lives. It is the basic material used in construction and car manufacturing, as well as household appliances. In order to maintain its properties over a long period of time, high quality is a fundamental requirement. X-ray fluorescence is the technique used for quality control for both bulk analysis and small spot analysis and elemental distribution mapping.
The integration of the ED core into the Zetium spectrometer sees two technologies, namely WD- and EDXRF, converging to make a unique and powerful analytical heart called SumXcore technology, which delivers specific benefits for metals applications, such as:
This data sheet demonstrates the capability of practical, fast small spot analysis and elemental distribution mapping of a steel sample for quality control purposes.
Measurements were performed using a Zetium XRF spectrometer configured with 4 kW Rh-anode, SST R-mAX X-ray tube and a WD core for traditional WDXRF analysis. To enable the spot analysis and mapping capability, the spectrometer was equipped with an ED core, high-precision translation mechanics for sample positioning and a high- resolution camera for sample imaging. Using the ED core offers the advantage of performing simultaneous analysis of all elements present, whereas using the WD core would imply already knowing which elements are present and repeating each spot analysis for the number of elements needed to be mapped. All measurements were conducted using the state-of-the-art SuperQ software package.
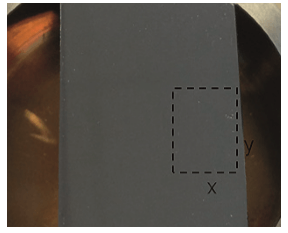
The steel sample was mounted in the special mapping sample holder provided -and imaged using the high-resolution camera. The sample was then loaded into the measurement position and the SuperQ software was used to identify features and areas to be analyzed on the sample. It is important to note that the sample surface did not show heterogeneities visible to the eye (Figure 1).
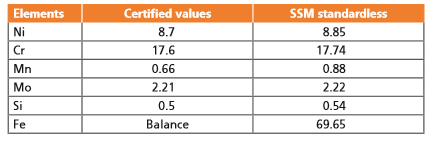
In order to map the elemental distribution on a small area, a standardless application was set up using Omnian setup samples and additional pure metal samples. The standardless method was validated against the certified reference material SS 466.
The sample area selected was 5.75 x 8.75 mm in size and mapped using a total of 864 spots. Each spot was measured for 100 seconds, giving a total measurement time of 27.4 hours.
Table 1 shows that good accuracy can be obtained with the standardless method even on a small area. The distribution of five critical elements and their concentrations is illustrated in Figure 2.
Table 1. Validation of Omnian calibration using a Certified Reference Material (SS466)
The compositional images show differences in element distribution, revealing previously identified heterogeneities that may indicate problems during the production process. The distribution of Fe appears to be homogeneous over the entire surface analyzed except for a highlighted area, corresponding to the green, yellow and blue areas in the Fe plot in Figure 2, where it shows lower concentration, corresponding to higher concentrations of Mn, Mo and Cr, suggesting a coupled substitution between those elements and Fe. This application shows the potential impact of performing practical compositional mapping at production control, where results can contribute tremendously to improving the manufacturing processes
Figure 1. Steel sample mounted on a special mapping sample holder. The measured area is highlighted by the black rectangle
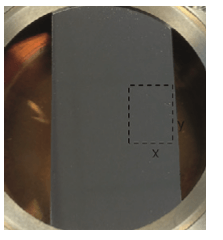
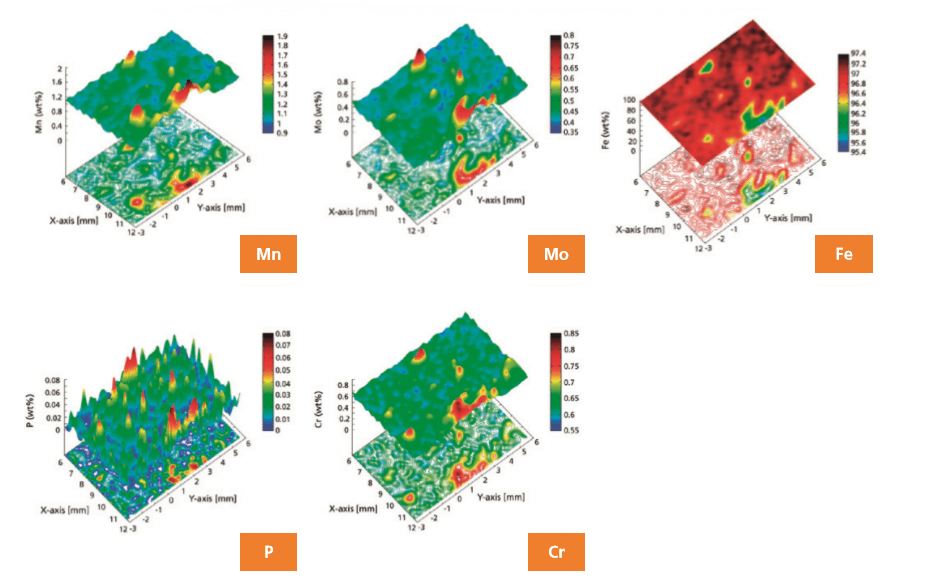
Figure 2. a2D and 3D contour plots for Mn, Mo, Fe, P and Cr in a steel sample and high- resolution image indicating sample area mapped.
The results clearly demonstrate that the integration of EDXRF (equipped to perform small spot analysis and mapping) in the Zetium spectrometer delivers fast and accurate analysis on a small scale (0.5 mm) for the quality control of steels. The possibility to perform small spot analysis and mapping using the ED core enables fast simultaneous analysis of all elements present without compromising the analytical performance of the WDXRF optics. Furthermore it is considerably faster than using conventional WDXRF, where each element present needs to be measured sequentially. The inclusion of the ED core has other advantages, such as fast sample screening, with or without Omnian, and identification and flagging of unexpected elements in process control.