Rietveld analysis of a hydrated mixture of Portland cement, slag, fly ash and limestone was performed in order to determine the relative quantities of the crystalline and amorphous phases in a single unhydrated sample and five variously hydrated samples. The results were analyzed so as to distinguish and to quantify the different amorphous phases.
In this application note we will reveal a methodology that allows the quantification of the individual amorphous (or poorly crystalline) contributions. Using this strategy we determine the reaction kinetics of a blended cement containing both fly ash and slag.
The drive to reduce CO2 emissions has led to many innovations in the cement industry. A well-known example is the production of blended cements whereby clinker is partially replaced by supplementary cementitious materials (SCM) such as fly ash and slag. These not only contribute to sustainable production, but may also have improved properties compared to the classical Ordinary Portland Cement (OPC). These properties are, for a large part, determined by the mineralogical composition of the cement as well as the reaction kinetics during the hardening process.
For OPC the reaction kinetics are well known and have been extensively studied with X-ray diffraction in combination with Rietveld analysis [1]. This type of analysis yields the development of the composition over time of the crystalline phases and the poorly crystalline calcium silicate hydrate (CSH) phase that is formed from the reaction of alite, belite with water. In case of blended cements the kinetics become more complicated because the phases present in the SCMs also play a role in the hydration reaction. With more crystalline phases in the mix and multiple amorphous phases coming from the SCMs and the CSH phase, the quantification analysis becomes more challenging.
In the most complex cements (e.g. CEM-V), there are up to three amorphous contributions coming from two different SCMs and the CSH phase. These have a strong diffraction peak overlap and are difficult to distinguish. Yet, it is imperative that they are quantified separately as each amorphous phase contributes to the reaction kinetics differently. In this application note we will reveal a methodology that allows the quantification of the individual amorphous (or poorly crystalline) contributions. Using this strategy we determine the reaction kinetics of a blended cement containing both fly ash and slag.
Rietveld analysis of a hydrated mixture of Portland cement, slag, fly ash and limestone was performed in order to determine the relative quantities of the crystalline and amorphous phases in a single unhydrated sample and five variously hydrated samples. The results were analyzed so as to distinguish and to quantify the different amorphous phases.
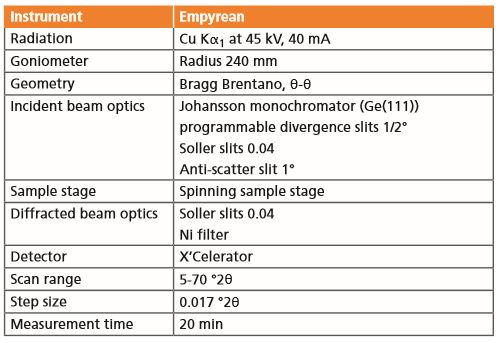
For this experiment an Empyrean diffractometer was used. The system was equipped with a Johansson monochromator that removes the Cu Kα2 radiation. This way, small features that are otherwise shadowed by Cu Kα2 were revealed. Further, this configuration yields a better peak-to-background ratio allowing better separation of the amorphous content and the background.
The samples were each from the same system containing 50 wt% of clinker, 20 wt% of slag, 30 wt% of fly ash. The five hydrated samples underwent hydration times of 1, 2, 7, 28 and 91 days respectively. The raw dry materials were homogenized and mixed with de- ionized water in a vacuum mixer.
Cylindric PE vessels were filled with the paste mixture and after the respective hydration times, the hardened cylinders were removed from the vessel. Each cylinder was then cut into slices. To remove the water from the slices and to stop the hydration reaction, they were towel-dried and immersed in isopropanol. After drying, the slices were sanded to achieve a flat surface and mounted into the sample holders
Overview of the Empyrean diffractometer with Johannson monochromator, programmable divergence slit, spinner, programmable anti-scatter slit and X’Celerator detector
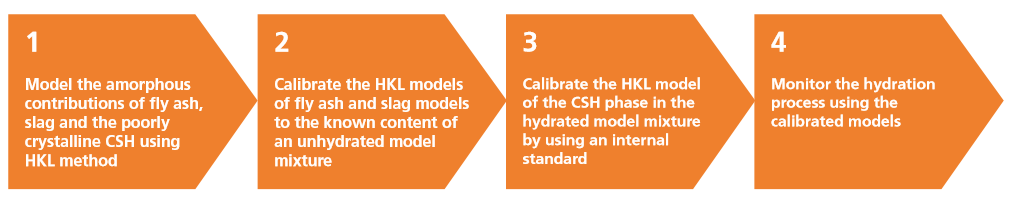
The basic ingredient for the analysis strategy consists of modeling the diffraction signal from the poorly crystalline or even amorphous content. For the slag and fly ash this is done using the PONKCS method (phases with Partial Or No Known Crystal Structure) [2].
The next step is to calibrate the models. This is done by relating the area underneath the HKL models to the weight percentage of amorphous or poorly crystalline material in the sample.
With the peak shapes of the fly ash, slag and CSH correctly modeled and calibrated, we can investigate the full hydration process. The flow of the full analysis is summarized in the figure below.
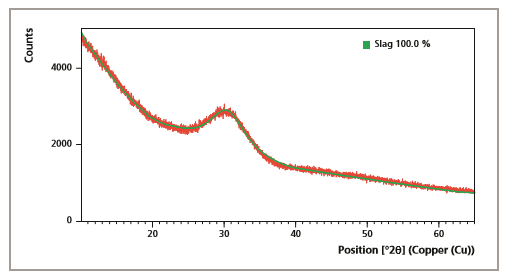
In most of the cases, slag is close to 100% amorphous and its diffractogram shows a single amorphous broad hump with a peak around 30° 2θ. As shown in Figure 1 it can be modeled with either a single-peak HKL phase or with the PONCKS model.
Figure 1. PONCKS model of slag
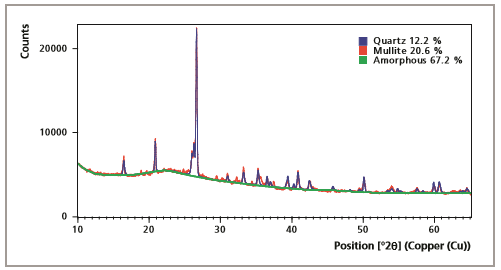
For fly ash, the case is slightly different (Figure 2) as it consists of both an amorphous content with a broad peak around 22° 2θ and crystalline contributions from mullite and quartz. With the PONCKS method, it is possible to model the fly ash as a whole. However, we chose to model the crystalline and amorphous phases of the fly ash separately. The amorphous hump cannot be assumed to be 100% and using the internal standard method it was determined that the amorphous content of fly ash is 67%. The crystalline mullite and quartz contribute 21% and 12% respectively to the total content.
It should be noted that each different type of slag and fly ash has a different diffraction signal. Therefore, different HKL- models should be created for each type of slag and fly ash.
Figure 2. PONCKS model of the amorphous part of the fly ash
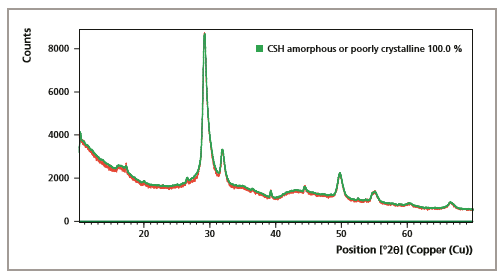
For the CSH phase, which is poorly crystalline, the PONKCS method was used to model its total shape as shown in Figure 3. Although the CSH phase shows crystalline features, it is treated as completely amorphous. Normally CSH is formed during the hydration process and in order to model it, synthesized CSH was used.
The results for the amorphous and poorly crystalline components of the individual phases of the fly ash, the slag and the CSH were then ready to be incorporated into the subsequent Rietveld refinement in HighScore Plus.
Figure 3. PONCKS model of the CSH phase
In order to calibrate the slag and the amorphous part of the fly ash, a model mixture of clinker with 20% slag and 30% fly ash was used. Thus, in this model mixture the amorphous contribution from the slag was 100% x 20% slag = 20% slag. The amorphous contribution from the fly ash was 67% x 30% = 20%.
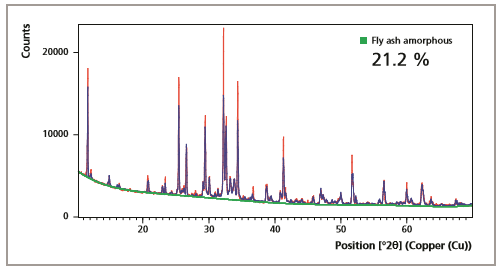
Running the Rietveld refinement in HighScore Plus on the model mixture, the slag and fly ash were refined along with the crystalline phases. The next step is to fine-tune the pseudo mass PONCKS models of the slag and fly ash to 20%. The results for the slag and amorphous part of the fly ash are shown in Figure 4 and Figure 5. From the calculations it now follows that the slag contributes 19.9%, while the amorphous part of the fly ash contributes 21.2%, which is within the typical accuracy of this type of analysis.
Figure 4. Calibrated PONCKS model of the slag
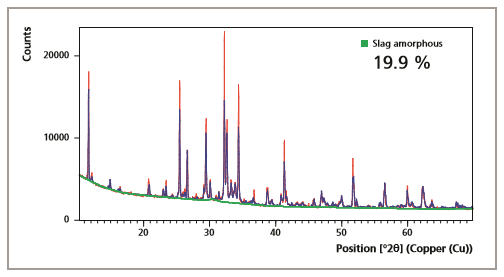
Figure 5. Calibrated PONCKS model of the fly ash
Using the internal standard method [3], the calibration was cross-checked. With the internal standard method it was determined that the model mixture contains 41% amorphous content. The sum of the slag and the amorphous part of the fly ash using the calibrated PONCKS method is 41.1%. This agreement validates the calibrated PONCKS models of the slag and fly ash.
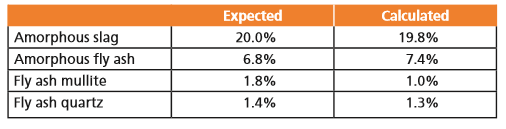
In order to further prove the validity of the PONKS models of the slag and fly ash, another model mixture was prepared containing the same slag and fly ash. The model mixture contained 50% cement (CEM-I), 20% limestone, 20% slag and 10% fly ash. The amorphous contributions should be 20% from the slag and 10% x 68% = 6.8% from the fly ash. The total amorphous content is thus 26.8%. The Rietveld refinement of this model mixture containing the crystalline phases and the PONCKS models is shown in Figure 6.
The results of the quantification in comparison with the expectations are summarized in Table 1. As can be seen, the results are with ~ 1% accurate.
Figure 6. Rietveld refinement of the 50% cement, 20% limestone, 20% slag and 10% fly ash model mixture
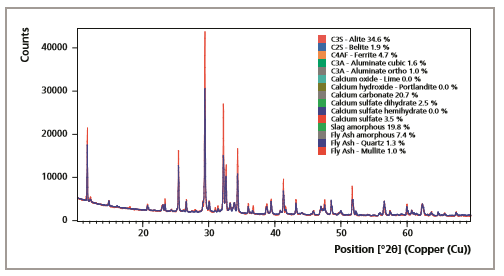
Table 1. Expected versus calculated amorphous contributions
For the calibration of the CSH phase, the model mixture with 20% slag and 30% fly ash was used and was hydrated for 28 days. At this point, the PONCKS models for the slag and fly ash had been calibrated, whilst the PONCKS model for the CSH phase was still uncalibrated. A Rietveld refinement was performed yielding weight percentages for the crystalline phases, slag, amorphous part of the fly ash and CSH phase. These weight percentages are still incorrect, as the PONCKS model of the CSH phase is still not calibrated. The next step is to determine the total amorphous content using the internal standard method. Calibration is now achieved by fine-tuning the pseudo mass of the PONCKS model of the CSH phase to the total amorphous content, see Figure 7.
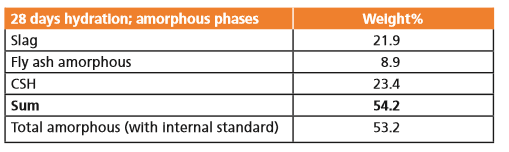
The results of the calculations are shown in Table 2. Comparing the sum of the individual amorphous contributions (54.2%) to the total amorphous content determined with the internal standard (53.2%) yields the typical accuracy of ~1% for this type of analysis.
Figure 7. Calibrated HKL model of the CSH phase
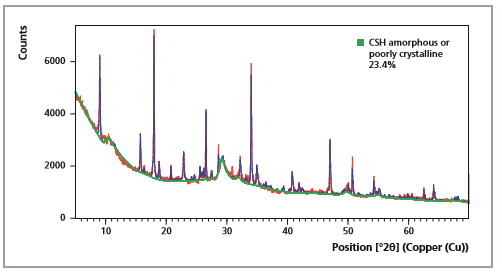
Table 2. Expected versus calculated amorphous contributions
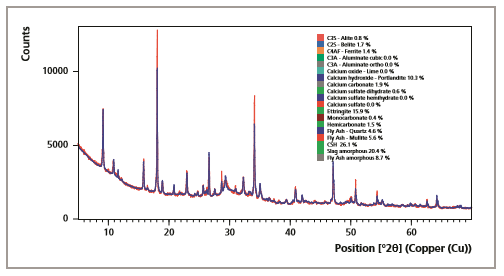
For the full hydration study the mixture of 20% slag and 30% fly ash was again used and measurements were done after 1, 2, 7, 28 and 91 days of hydration. The diffractograms of the samples hydrated for 1 and 28 days are shown in Figure 8 and Figure 9.
Figure 8. 1-day hydrated sample
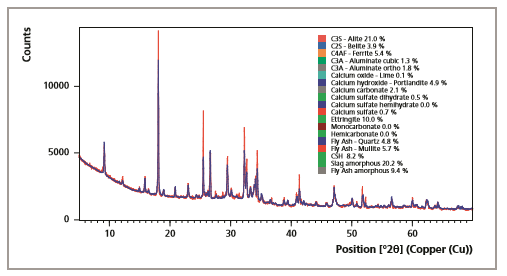
Comparing the two figures it can already be seen that the sample shows a typical hydration reaction, where CSH is formed from alite and belite. The features of the poorly crystalline CSH phase are clearly emerging around 30° 2θ (see also Figure 3).
Figure 9. 28-days hydrated sample
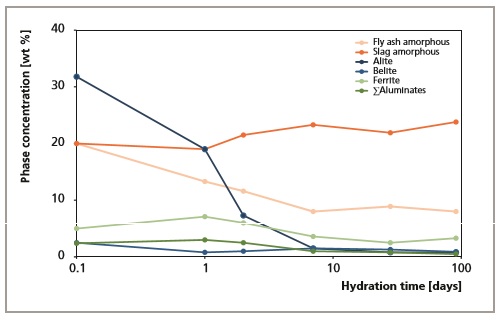
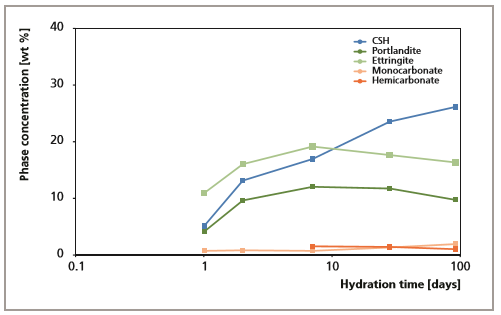
The full hydration reaction can be followed in detail in the trend plots in Figure 10 and Figure 11. Very clearly, the amount of CSH phase increases over time formed from the alite and belite in combination with water. Within an error of +/- 2 %, it can be assumed that the slag content is nearly unchanged and seemingly does not play a role in the reaction. On the other hand the amorphous part of the fly ash drops down to the detection limit of ~7% at the 7th day. Clearly the amorphous part of the fly ash does play a role in the reaction.
Figure 10. Hydration kinetics of the starting phases in slag / fly ash cement
Also the reactions of the crystalline phases are as can be expected: ettringite increases over time as it is formed from the sulfate and aluminate phases, which in turn decrease over time. After the 7th day, the ettringite concentration decreases again slightly to form the so-called mono-phases (i.e. monocarbonate and hemicarbonate).
Figure 11. Hydration kinetics of the reaction products in slag / fly ash cement
With the emergence of more complex cements, new challenges arise in the analysis of phases and in relating those phases to important cement properties. In addition to the many crystalline phases, these complex cements also contain multiple amorphous phases, whose diffraction signals strongly overlap. It is imperative that these amorphous phases are analyzed individually as they each contribute differently to the final properties.
In this application note we have provided a novel strategy that allows the individual quantification of multiple amorphous phases in these complex cements. We have shown that with this strategy it is possible to follow the hydration reaction of a complex cement that includes amorphous phases from fly ash, slag and the CSH phase. The results are shown to be stoichiometrically correct and are accurate within ±2 wt % (abs).
This strategy can also be applied to other systems with multiple amorphous phases.