Metallic additively manufactured products can now be found all around us, from bicycle frames and golf clubs to component parts for clocks and vehicles. These products all maintain a high quality of finish and function. You may wonder, what is the crucial factor that allows this quality to be consistently achieved? It all starts from the base material; the metal powder itself.
High integrity powder metallurgy (P/M, the processes for manufacturing metallic components from metal powders) for applications such as additive manufacturing often has strict specification requirements.1 One such requirement is the particle size distribution of the metal powders in question which can affect several of the inherent properties of the powder including; bulk density, flowability, moldability, compressibility, and die-filling characteristics.
Please login or register to read more
Metallic additively manufactured products can now be found all around us, from bicycle frames and golf clubs to component parts for clocks and vehicles. These products all maintain a high quality of finish and function. You may wonder, what is the crucial factor that allows this quality to be consistently achieved? It all starts from the base material; the metal powder itself.
High integrity powder metallurgy (P/M, the processes for manufacturing metallic components from metal powders) for applications such as additive manufacturing often has strict specification requirements.1 One such requirement is the particle size distribution of the metal powders in question which can affect several of the inherent properties of the powder including; bulk density, flowability, moldability, compressibility, and die-filling characteristics.
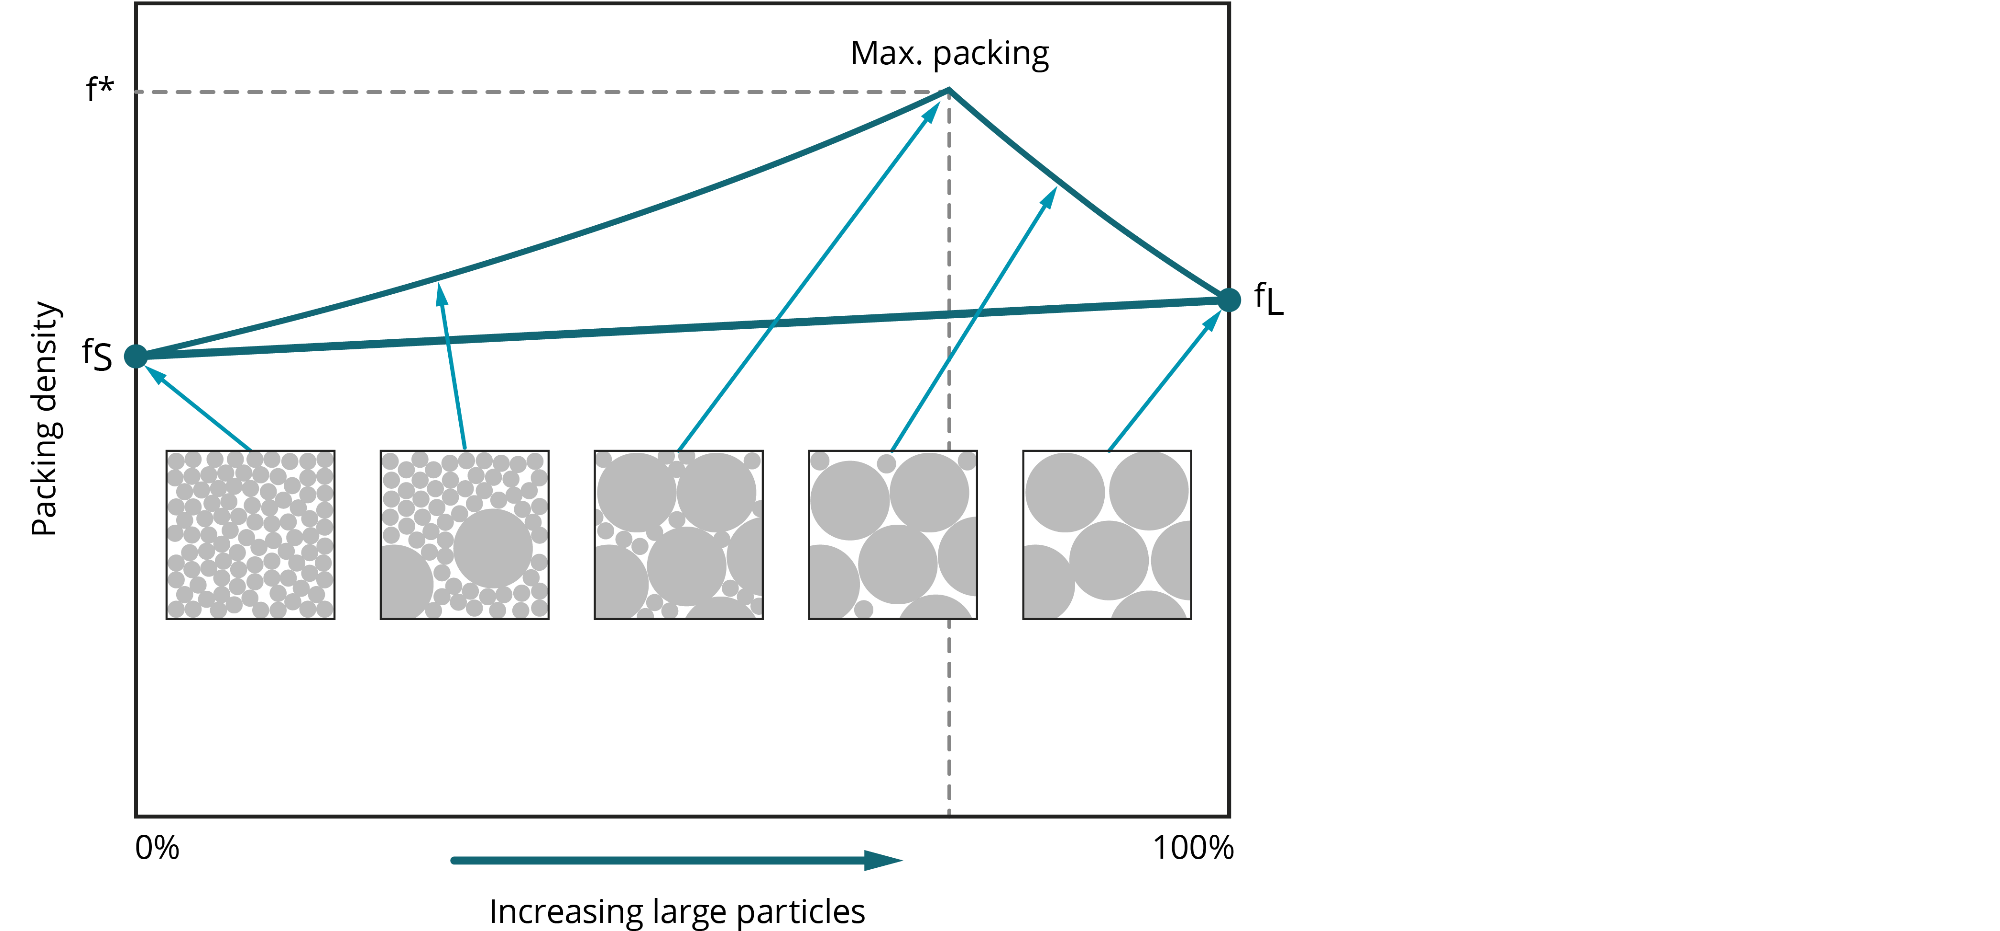
An easy way to picture the packing of the particles is to consider a mixture of different sized balls in a box. The packing density is at maximum when the ratio of large and small balls is optimal, where small gaps in the packing of the larger balls are filled by the smaller ones. This is illustrated in figure 1. Too many large particles will reduce the packing density, while too many small particles will result in reduced flowability due to the cohesion of the powder particles and sub-optimal packing. There is a compromise for additive layer manufacturing though as it’s important to ensure a consistent layer thickness also. For that reason, a narrower particle size distribution is usually preferred.
Particle packing and flowability are important for most powder metallurgy applications, especially additive manufacturing, which is why it is important to optimize the particle size distribution to achieve the desired ratio of large and small particles. Flow and packing characteristics are not the only factors that need to be considered; particle size can also affect compressibility, which is important for pressed powder applications as well as the surface texture and dimensional accuracy of injection molded parts. A knowledge of particle size distribution and how it impacts the inherent properties of a powdered metal and a final part is therefore vital for ensuring that the powder is suitable for a particular application. It is also important for ensuring that the powder is within the specified limits to enable the produced part to achieve the desired quality.2
There are several different analytical techniques that can be used to verify the particle size distribution of metal powders. Laser diffraction is one particularly common method employed for this important process, favored for its ease of use and fast analysis time. Laser diffraction systems, such as the Mastersizer 3000 (MS3000), determine particle size from measurements of the light scattered by the sample material. Larger particles will scatter light at smaller angles and with high intensity, while smaller particles will scatter light at larger angles and with weaker intensity. The diffracted, or scattered, light is captured by detectors placed around the measurement cell at a range of angles relative to the incident laser beam. This includes focal plane detectors that capture light scattered by larger particles, through to back-scatter detectors that capture light scattered by smaller particles. This is illustrated in figure 2 below.
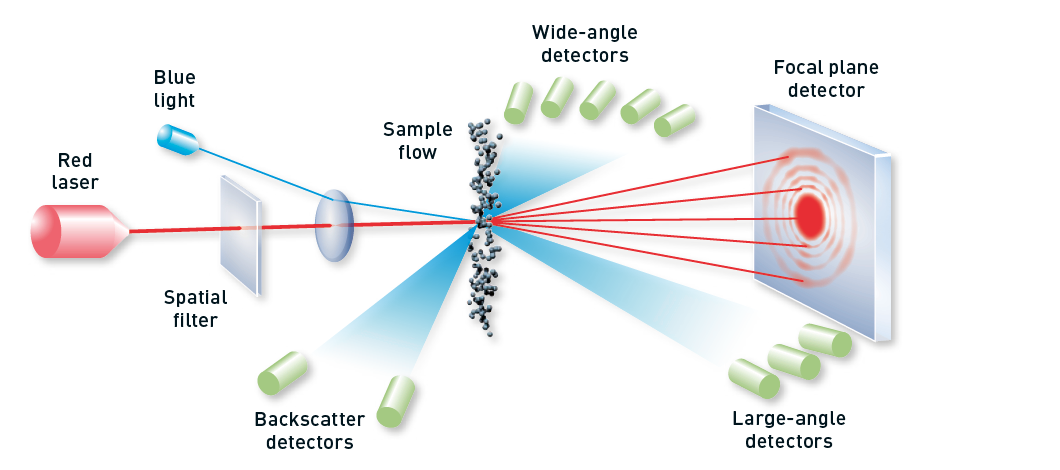
Figure 2: Illustration of a laser diffraction measurement using Mastersizer 3000.
The MS3000 covers a very broad dynamic range that allows for the accurate measurement of metal powder particle size distributions as used across the spectrum of P/M applications; from those <25µm used in Metal Injection Moulding to those up to 1mm used in Hot Isostatic Pressing. This broad range is enabled by the two separate light sources used by the MS3000; the 633 nm HeNe gas laser allows effective measurement of scattered light by particles at the larger end, while a 470 nm solid-state blue light source provides an enhanced intensity of the scattered light from sub-micron particles.
As laser diffraction is sensitive to the volume of particles, the volume-weighted particle size distribution reported by the MS3000 is highly efficient at revealing the presence of any small quantities of oversized or agglomerated material that could cause a powder sample to be out of specification. For example: powders to be used in the process of metal injection molding are required to have sizes < 38µm as a minimum, as shown in figure 3.
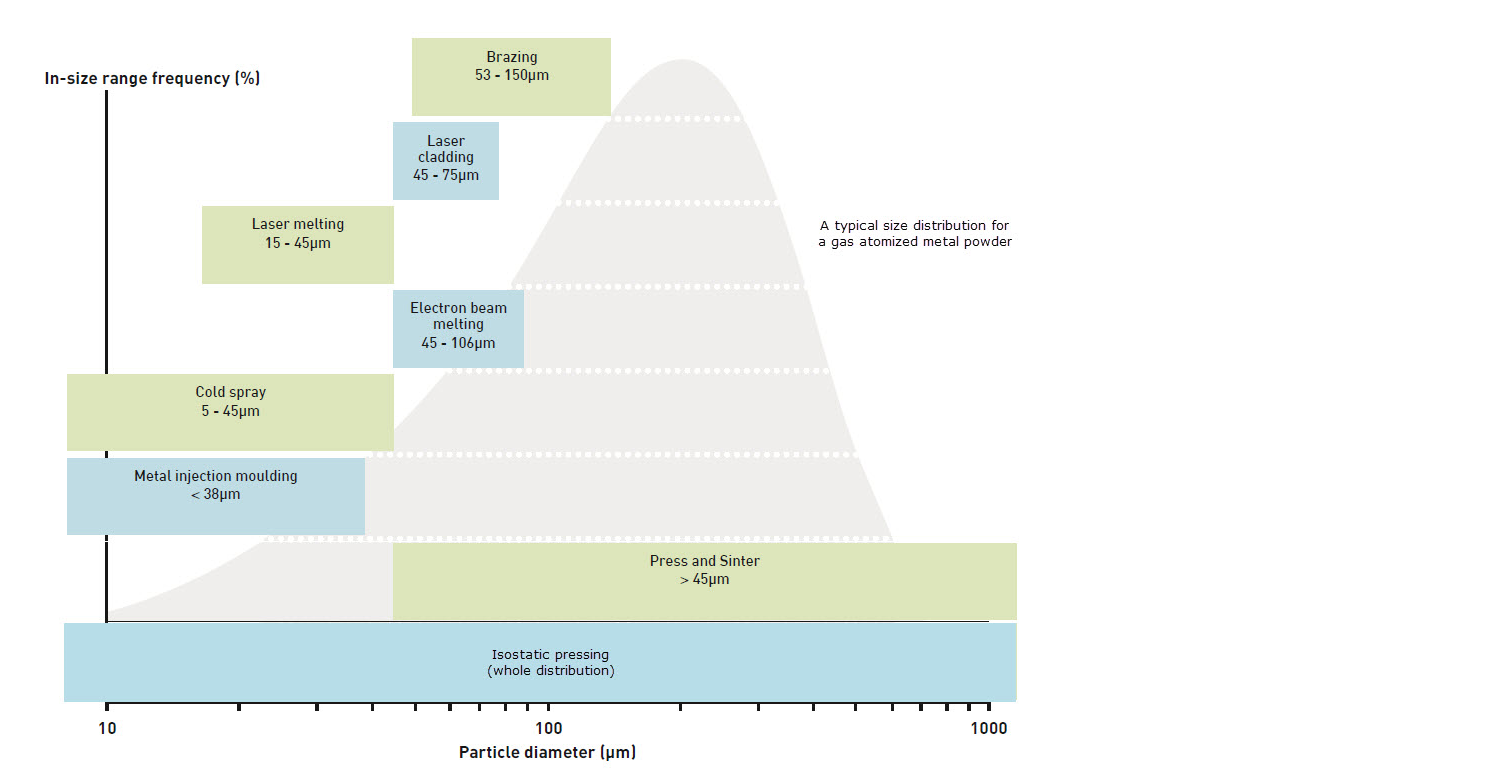
Figure 3: Typical as-atomized particle size distribution of gas atomized powders including required size distributions for various advanced powder metallurgy manufacturing technologies.4
One important factor to consider is when and whether the metal powder sample should be measured in a wet or dry dispersion. The MS3000 enables the straightforward application of both methods through a simple change of measurement cells and accessories.
Dry dispersions allow the powder to be measured in the state in which it is used in the P/M process and allows for superior sampling of a batch due to the possibility of measuring large quantities of powder in a single measurement process. Dispersive forces such as velocity gradients and particle-to-particle collisions can be controlled through adjustment of the air pressure drop. An air pressure titration method is used to find the point at which increasing the pressure no longer affects the size of measured particles, i.e. where the primary particle size has been achieved. If the primary size is not achieved the introduction of a high-energy venturi provides particle-to-wall collisions in order to break up robustly aggregated samples. However, the properties of some metal powders may render them less suitable for measurement in a dry dispersion. On a practical level, they could be fragile and friable, meaning that the application of enough energy for complete dispersion must be balanced with the risk of particle breakage and milling. There could also be health and safety concerns if, for example, the powder carries ignition risks.
As an alternative, the metal powder can be measured in a wet dispersion. The dispersive forces from stirring, and sonication if needed, can be used to remove agglomerated material. Indeed, similar to the pressure titration for dry measurements, method development follows the process of increasing stirrer speed (and sonication duration if needed) to the point at which the size is no longer affected. This indicates a stable dispersion of primary particles.
The wetting of the particle surfaces reduces surface energy and inter-particle interactions, while also removing any risk of ignition. Although the whole process may be slower than dry measurements and requires the use of a liquid dispersant, less sample material is needed and the sample can also be recovered after measurements. Furthermore, it can be useful in many cases to compare the result of a well-dispersed wet measurement of a sample with that of a dry measurement to verify that the primary particle size is indeed achieved in the dry dispersion.
Validation of the primary particle size of industrially relevant powders is an essential outcome from the measurement process where powder metallurgy and additive manufacturing is concerned. In this study, the particle size distributions of four samples of stainless-steel powders for use in different powder metallurgy processes were measured in both wet and dry dispersions and the results compared. The required PSD limits and the intended process application of each sample is listed in table 1.
| Particle size distribution (µm) | Material | Process |
|---|---|---|
| < 25 | 316L | Metal Injection Moulding |
| 20 - 64 | 316L | Additive Manufacturing |
| 64 - 150 | 316L | Laser Cladding |
| < 150 | 316L | Hot Isostatic Pressing |
Dry dispersions were measured with a modest air pressure of 1 bar, whereas stir speeds of 2500 RPM for the Metal Injection Moulding & Hot Isotactic Pressing samples, and 3000 RPM for the Additive Manufacturing and Laser Cladding samples, were used for measurement of the wet dispersions.
As can be seen in figure 4, there is close agreement between the PSDs of the measured wet and dry dispersions of the samples, indicating that complete dispersions of the materials and identification of the primary particle size was achieved in most of these cases.
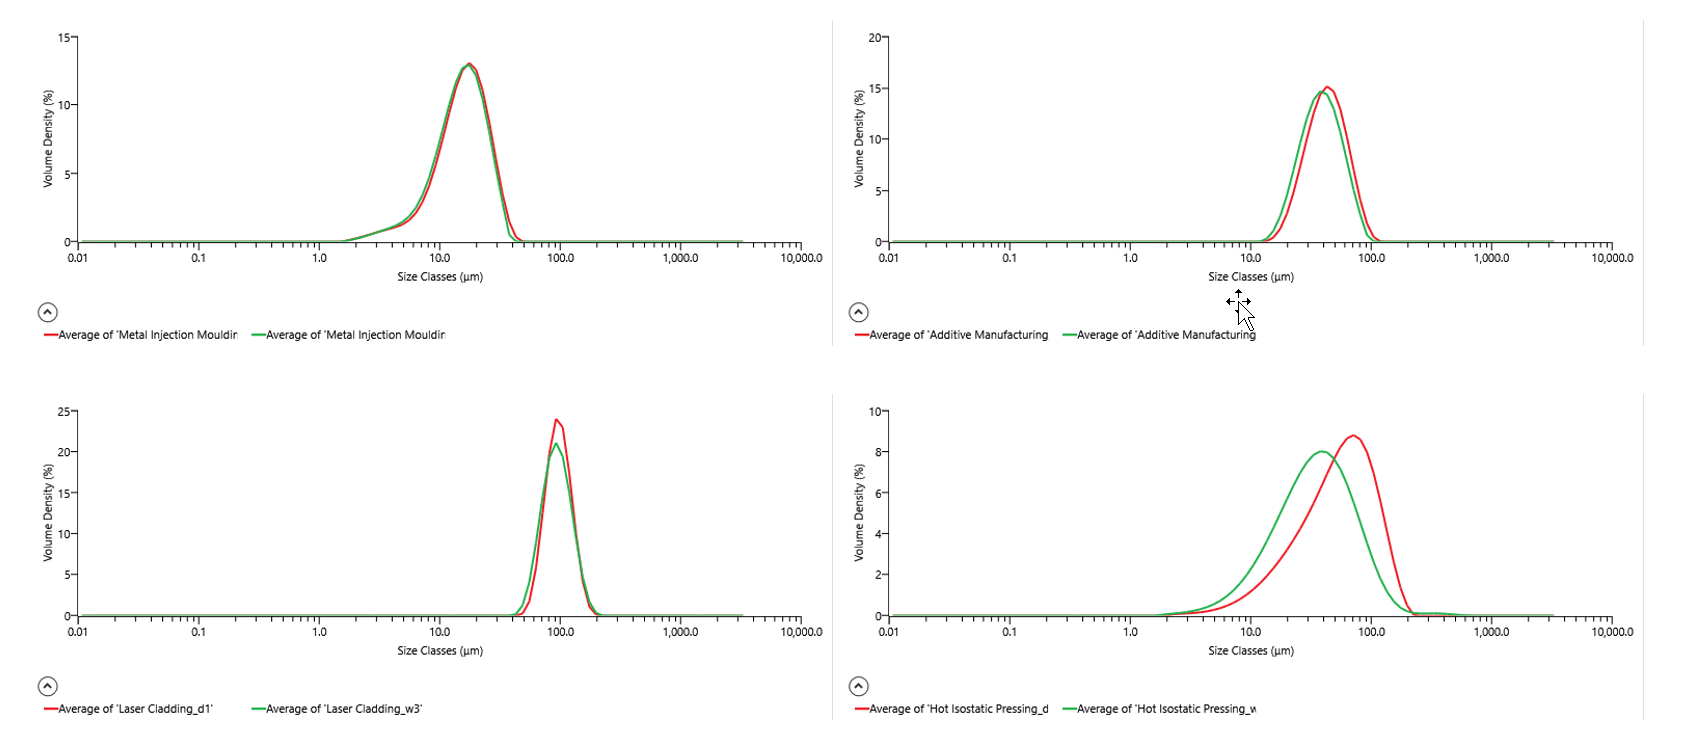
Figure 4: Comparisons of wet and dry measurements for each stainless steel 316L powder sample. In each case, the red trace is the dry measurement PSD and the green trace is the wet measurement PSD (each PSD shows the average result over five measurements).
A shift in the PSD to finer sizes in the wet measurement is seen for the samples of powders for additive manufacturing (Dv 50 = 42.3µm dry and 38.2µm wet) and hot isotactic pressing (Dv 50 = 54.7µm dry and 34.6µm wet). In the case of the wet measurements, it is likely that some of the coarse, denser material is sedimenting in the dispersion unit and is not flowing through the measurement cell. As the whole sample is always captured in the dry measurements, this can lead to differences in the results if the PSD is rather wide overall and the material is particularly dense. A shift in the PSD to finer sizes in the wet measurement is seen for the samples of powders for additive manufacturing (Dv 50 = 42.3μm dry and 38.2μm wet) and hot isotactic pressing (Dv 50 = 54.7μm dry and 34.6μm wet). This difference is greatest for < 150µm fraction which contains both large and fine size fractions suggesting that under dry conditions the fine particles may be adhering to the larger particles. If this is the case, then a higher pressure could be applied to increase the intensity of the dispersive forces in the dry state and produce a more identical result to the well-dispersed wet measurement.
The particle size distribution of metal powders is an integral and defining parameter that must be monitored to ensure that batches of material are within specification and can provide the desired in-process behavior and finished product performance. Laser diffraction is both a fast and efficient method for measuring the particle size distribution of metal powders over a very wide dynamic range in both dry and wet dispersions. Closely matching results between dry and wet measurements of the same sample can be obtained and comparing the two allows the primary particle size, and indeed the whole size distribution, to be validated.
We would like to acknowledge the Manufacturing Technology Centre (MTC), Coventry, UK, for providing samples and data for this work, and Finance Birmingham who funded the original work at MTC under the AMSCI-funded CASCADE program.