Twelve indicators of result quality are combined to give a quality factor which is displayed on every report to simplify data interpretation. A separate size quality report provides more detail, and this technical note expands on this.
The quality of data obtained from a dynamic light scattering (DLS) measurement is paramount to the reliability of the result obtained. To simplify the interpretation of the data from a dynamic light scattering measurement, a size quality report has been developed for the Zetasizer Nano range of instruments.
This size quality report is displayed by default as one of the tabs in the size workspace. Several tests are performed on a selected record and if any of the tests fall outside specified limits, a warning message is displayed together with advice of possible reasons for the warning, and a result quality ‘Refer to quality report’ is displayed in green in the sample report. If none of the tests fail, a “Result Meets Quality Criteria” message is displayed in the Size Quality Report, and a result quality ‘Good’ is displayed in green in the sample report.
The size quality report incorporates 12 tests on any selected record. Table 1 is a summary of the tests incorporated and lists descriptions and details of the tests, the warning message that is displayed, possible reasons for the warning message and actions that might remedy it.
This technical note uses example results to illustrate the warning messages and provides details of possible actions of how to improve the results.
| Test Number | Test Description | Test Details | Warning Message | Possible Reasons
for Warning Message | Possible Actions |
|---|---|---|---|---|---|
| 1 | Check appropriate lower size analysis limit used in the distribution analysis | Is the z-average diameter < lower analysis limit? | z-average is smaller than lower size analysis limit | The wrong lower size analysis limit used in the distribution analysis settings. Only applicable to research software | Edit the lower size analysis settings in the research software |
| 2 | Check appropriate upper size analysis limit used in the distribution analysis | Is the z-average diameter > upper analysis limit? | z-average is larger than upper size analysis limit | The wrong upper size analysis limit used in the distribution analysis settings. Only applicable to research software | Edit the upper size analysis settings in the research software |
| 3 | Check appropriate lower size display limit used | Is the z-average diameter < lower display limit? | z-average is smaller than lower display limit | The wrong lower display limit used. | Edit the lower display settings |
| 4 | Check appropriate upper size display limit used | Is the z-average diameter > upper display limit? | z-average is larger than upper display limit | The wrong upper display limit used. | Edit the upper display settings |
| 5 | Check polydispersity index value | Is the polydispersity index value > 1? | Polydispersity index is very high | Sample is very polydisperse and
may not be suitable for DLS measurements | Sample may not be suitable for DLS technique |
| Sample contains large particles/ aggregates/ dust | Remove large particles/ aggregates/ dust by filtration or centrifugation | ||||
| Wrong measurement position used (applicable only to Nano S/ZS/ZSP) | Seek for optimum measurement position should be selected | ||||
| 6 | Check correlation function intercept value | Is the correlation function intercept <0.1 or >1.0? | Correlation function intercept out of range | Sample concentration too high (multiple scattering) | Dilute sample and re-measure |
| Sample concentration too low | Increase sample concentration and re-measure | ||||
| Sample fluorescence | Use narrow band filter option | ||||
| User different laser wavelength | |||||
| Sample absorbance (coloured sample) | User different laser wavelength | ||||
| Wrong measurement position selected (Nano S/ZS/ZSP only) | Allow instrument to seek for optimum measurement position | ||||
| Sample contains very large particles (baseline definition problems) and may not be suitable for DLS measurements | Remove large particles/ aggregates/ dust by filtration or centrifugation | ||||
| 7 | Check first point selection for multimodal analysis | Is the first correlation point >3 and the z-average diameter <5nm? | Check first correlation point selection for multimodal analysis | Only applicable to research software and is a check that the first correlation point selection for the distribution analysis is suitable for the particle size obtained | Edit the first point selection for the distribution analysis and re-analyze the record |
| 8 | Check the in range value | Is the in range value less than 90% | The in range figure is low | Presence of large or sedimenting particles | Remove large particles/ aggregates/ dust by filtration or centrifugation |
| Sample fluorescence | Use narrow band filter option | ||||
| User different laser wavelength | |||||
| Sample absorbance (colored sample) | User different laser wavelength | ||||
| 9a | Check for low mean count rate | Is the mean count rate <20 kcps? | Count rate is out of range | Attenuator not set to automatic | Allow instrument to seek for optimum attenuator position |
| Sample concentration too low | Increase sample concentration and re-measure | ||||
| Sample absorbance (colored samples) | User different laser wavelength | ||||
| Sample is not stable during measurement | Sample may not be suitable for DLS technique | ||||
| 9b | Check for high mean count rate | Is the mean count rate >1000 kcps? | Count rate is out of range | Attenuator not set to automatic | Allow instrument to seek for optimum attenuator position |
| Sample contains large particles/aggregates/dust | Remove large particles/ aggregates/ dust by filtration or centrifugation | ||||
| Sample is not stable during measurement | Sample may not be suitable for DLS technique | ||||
| 10 | Check sufficient data collected | Is the total number of photons collected <10000K? | Insufficient signal collected | Measurement duration not set to automatic | Set instrument to automatic duration |
| Attenuator not set to automatic | Allow instrument to seek for optimum attenuator position | ||||
| Filter factor not set to default (50%).
Only applicable to research software | Edit filter factor setting in the research software | ||||
| 11 | Check the cumulants fit error | Is the cumulants fit error >0.005? | Cumulant fit error high | Data quality too poor for cumulant analysis | Sample may not be suitable for DLS technique |
| Sample too polydisperse for cumulant analysis | Sample more suitable for distribution analysis | ||||
| Inappropriate cumulant analysis settings in research software | Edit cumulant settings in research software | ||||
| 12 | Check the distribution fit error | Is the distribution fit error >0.005? | Multimodal fit error high | Data quality too poor for distribution analysis | Sample may not be suitable for DLS technique |
| Sample too polydisperse for distribution analysis | Sample may not be suitable for DLS technique | ||||
| Inappropriate distribution analysis settings in research software | Edit distribution settings in research software |
The (R) after a test indicates that the test is only applicable when using the optional research software
Z-Average is smaller than lower size limit
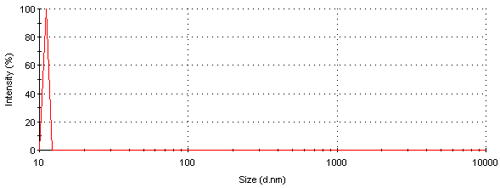
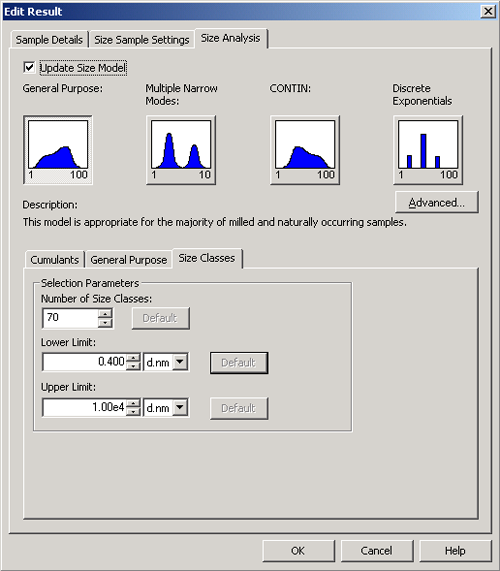
This test is only applicable to the research version of the Nano software where the distribution analysis limits have been manually selected incorrectly. Figure 1 shows the intensity size distribution obtained for a protein sample with a z-average diameter of 8.9nm. The lower distribution analysis limit has been manually set to 10nm in the research software. This has given “z-average is smaller than lower size analysis limit” warning message in the size quality report. To rectify the problem, the record needs to be selected in the Record View and edited (by clicking on Edit, Edit Result). This action brings up the Edit Result window. The Update Size Model option needs to be selected on the Size Analysis tab. After the appropriate distribution analysis model has been selected (General Purpose, Multiple Narrow Modes or CONTIN), the Size Classes tab should be accessed (figure 2). The Lower Limit needs to be changed either to the appropriate value or reset to the Default value of 0.4nm.
|
|
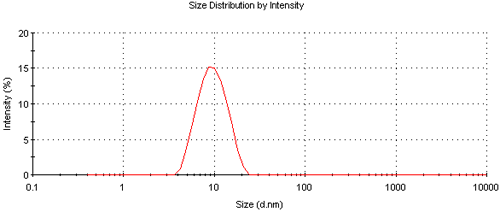
A new record will be calculated with these new settings implemented and will be displayed in the Record View. Figure 3 shows the intensity size distribution obtained for the edited record displayed in figure 2. The Size Quality Report now displays a “Result Meets Quality Criteria” message.
|
Z-Average is larger than upper size analysis limit
This test is only applicable to the research version of the Nano software where the distribution analysis limits have been manually selected incorrectly. This test is similar to that discussed in test 1 and any warning message can be rectified in the same way as discussed above (figure 2). The only difference being in the value used as the upper analysis limit.
Z-Average is smaller than lower display limit
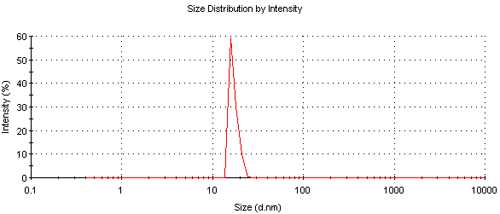
This test ensures that a suitable lower display limit is selected for the result. A warning message for this test would only be obtained if the user had manually set the lower display limit to an inappropriate value. Figure 4 shows the intensity size distribution of the protein sample used above as an example where the lower display limit has been set to 15nm. The left hand side of the distribution has been cut off at the lower display limit that has been set. This has given the warning message “z-average diameter is smaller than lower size display limit” in the size quality report. To correct this problem, the lower display limit needs to be edited in the record to an appropriate value.
|
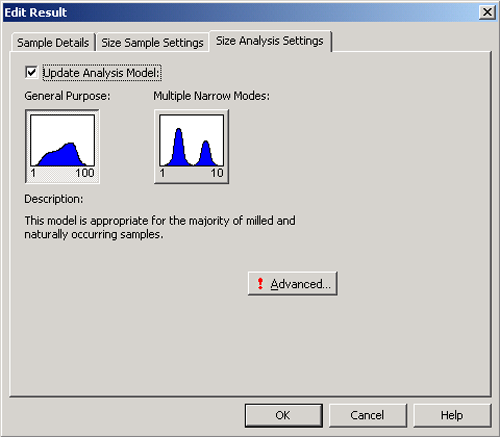
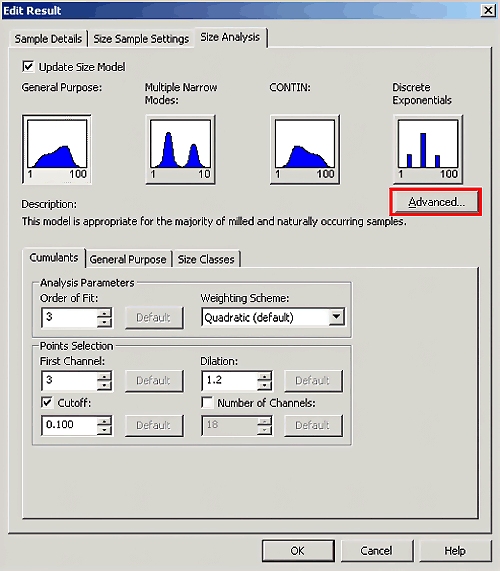
After selecting the record and clicking on Edit, Edit Result, the Size Analysis Settings tab needs to be selected in the Edit Result window. Selecting the Update Analysis Model allows the Advanced button to be accessed (figure 5). Note that the Size Analysis Settings are much simpler in the normal software compared to the Research software (figure 2). Also note that the Advanced button displays a red exclamation mark indicating that one of the settings is not at default value.
|
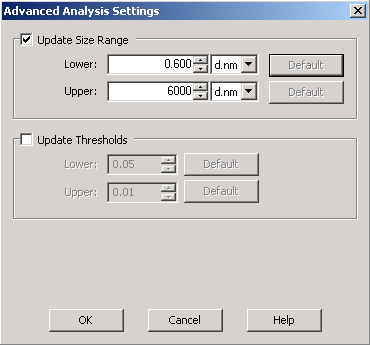
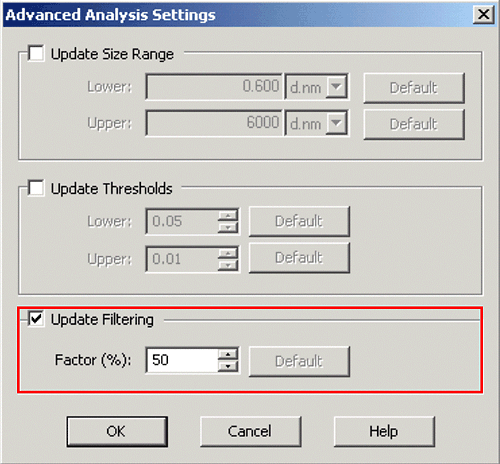
Clicking on the Advanced button gives access to the Advanced Analysis Settings (figure 6). This allows the Display Size Limits to be modified to appropriate values. Note that the default values for the lower and upper display limits are 0.6 and 6000nm respectively.
##fig6
|
A new record will be created with the edited settings in the Record View. The intensity size distribution obtained for the protein sample using default display limit settings is shown in figure 3. The Size Quality Report gives a “Result Meets Quality Criteria” message.
Z-Average is larger than upper display limit
This test is similar to that discussed in test 3 and any warning message can be rectified in the same way as discussed above (figures 5 and 6).
Polydispersity index is very high
The polydispersity index (PDI), together with the z-average diameter, is calculated from the cumulants analysis as defined in ISO22412:2008 and is a dimensionless estimate of the width of the distribution, scaled from 0 to 1.
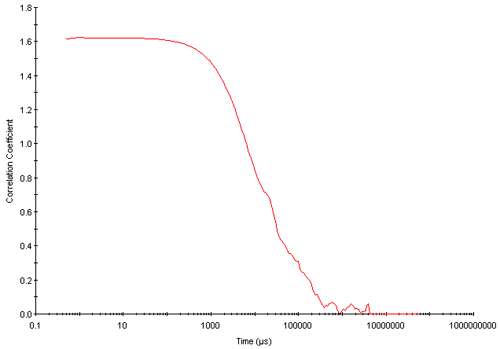
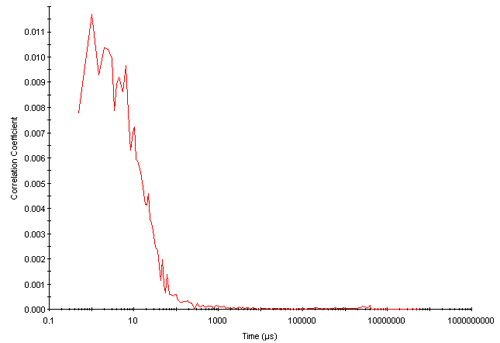
A PDI value of 1 indicates that the sample has a very broad size distribution and may contain large particles or aggregates that could be slowly sedimenting. If this is the case, the sample may not be suitable for a DLS measurement. Figure 7 shows a correlation function obtained from a sample consisting of a broad size distribution containing large, sedimenting particles (note the noisy baseline). This sample gave a PDI value of 1 and is a good example of a sample not suitable for the DLS technique. Note the intercept value is greater than 1.0 and further discussion of this will be given in test 6 below. Often, when a sample gives a PDI value of 1.0, cumulants and distribution fit errors are also obtained and these will be further discussed in tests 11 and 12 below.
|
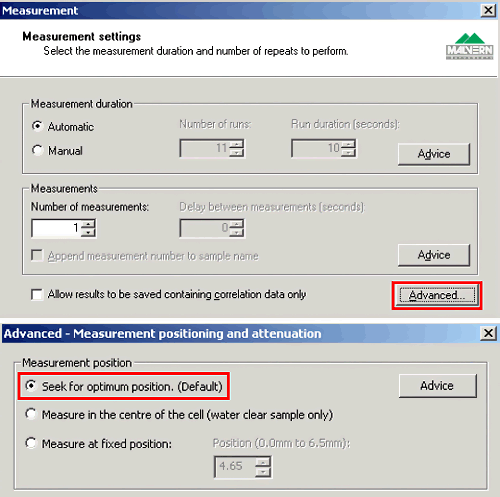
Another possible reason for obtaining a warning message with test 5 is that the wrong measurement position has been selected in a Zetasizer Nano S or ZS instrument. The default option is to allow the software to automatically seek for optimum position. However, the measurement position can be manually selected. The default option of seeking for the optimum measurement position is accessed by clicking the Advanced Button on the Measurement Settings window either when creating an SOP or setting up a Manual Measurement (figure 8).
|
Correlation function intercept out of range
The intercept value is the signal/ background ratio and the value will vary according to the sample and instrument optical configuration. Appropriate values are between 10% and 100% (i.e. 0.1 to 1.0). A lower than expected value may indicate too high or too low a sample concentration, absorption or fluorescence of the sample. Too high a sample concentration may lead to multiple scattering effects that will reduce the intercept value. The NIBS configuration of the Zetasizer Nano S/ZS allows for the path length of the laser beam to be minimized, which, in turn, will minimize any multiple scattering present. The wrong measurement position may have been manually selected resulting in multiple scattering effects. The default setting of allowing the software to automatically seek the optimum measurement position can be accessed as discussed in Test 5 above (figure 8).
Figure 9 shows a correlation function obtained from a sample exhibiting fluorescence and shows an intercept value of less than 0.1. Improved data may be obtained by using the narrow band filter option available for the Zetasizer Nano series. If this does not improve the data quality sufficiently then an instrument with a different wavelength of laser would be required.
|
The correlation function shown in figure 7 above was obtained from a sample containing large, sedimenting particles which cause interference in the measurement (number fluctuations). The presence of such large particles results in an ill-defined baseline and this causes the intercept value to be greater than 1.0. In addition, in range, cumulants and distribution fit error messages may also be obtained (see tests 8, 11 and 12 for further information). This sample will only be suitable for measurement using DLS if the large particles present can be suitably removed by, for example, filtration or centrifugation.
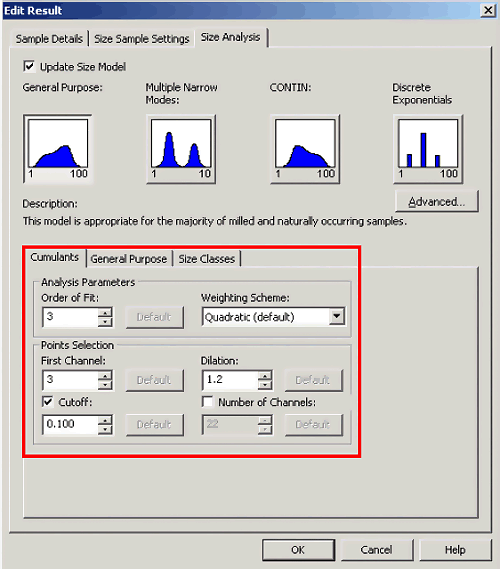
Check first correlation point selection for multimodal analysis
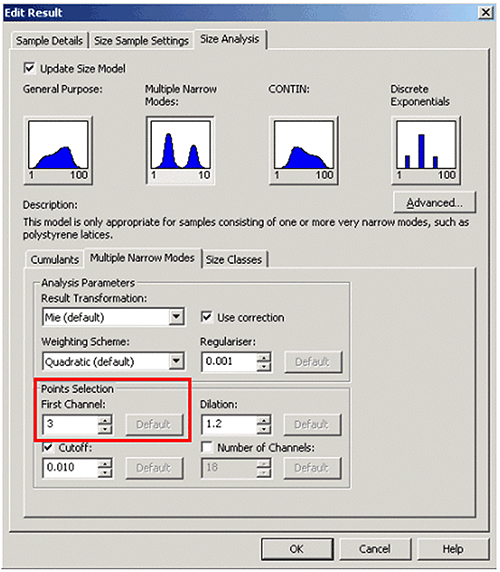
This test is only applicable to the research version of the Nano software and checks whether the first correlation point used in the distribution analysis is suitable for the particle size obtained. A warning message for this test would only be obtained if the user had manually set the first correlation point to an inappropriate value with the z-average diameter less than 5nm. To correct this problem, the record needs to be selected in the Record View and edited (by clicking on Edit, Edit Result). This action brings up the Edit Result window. The Update Size Model option needs to be selected on the Size Analysis tab. After the appropriate distribution analysis model has been selected (General Purpose, Multiple Narrow Modes or CONTIN), the Points Selection section can be accessed on the chosen distribution analysis tab (figure 10). The First Channel of the Point Selection needs to be changed either to an appropriate value or reset to the Default value of 3. A new record will be calculated with these new settings implemented and will be displayed in the Record View.
|
The in-range figure is low
The in range value is an indicator of the overall quality for good data obtained from a measurement. The maximum value achievable is 100% and most of the effects that conspire to ruin a measurement will reduce this figure.
The main reason for obtaining a warning message with this test is that the sample contains large, sedimenting particles. A typical correlation function from such a sample is shown in figure 7 above in which the sample is very polydisperse and the large particles present are causing baseline definition problems. This sample is not suitable for DLS measurement unless the large particles are removed by filtration or centrifugation.
Other possible reasons for low in range values are sample fluorescence or absorbance in which definition of the baseline may be problematic and/or the intercept value of the correlation function may be very low (see test 8 and figure 9 above).
Count rate is out of range
This test checks that sufficient scattering is being detected during a measurement.
There are various reasons that can account for this warning message, most of which are sample related. These include a sample concentration that is too low, a sample that shows strong absorbance of the laser beam, or a sample that is not stable during the measurement and may not be suitable for the DLS technique.
The Zetasizer Nano has an automatic attenuator that varies the intensity of the laser entering the sample cuvette. This subsequently varies the intensity of the scattered light detected. For samples that do not scatter much light, such as very small particles or samples of low concentration, the amount of scattered light being detected must be increased. The attenuator will therefore automatically allow more light through to the sample. For samples that significantly scatter light, such as large particles or samples at high concentration, the attenuator automatically reduces the amount of light that passes through to the sample. The attenuator in the Zetasizer Nano has 11 positions covering an attenuator range of 99.997% (position 1) to 0% (position 11). Therefore, if the attenuator position automatically selected is 11 (0% attenuation or 100% transmission) and the mean count rate is less than 20 kilo counts per second (kcps), it is indicative of very low sample concentration or strong sample absorbance. If the problem is low concentration, then the sample concentration needs to be increased if possible and re-measured. If the problem is strong absorbance, the only successful way to improve the results may be to use a different wavelength of laser.
Particles in a sample may be slowly dissolving, sedimenting or creaming during the measurement. In each of these cases, the mean count rate will reduce with time. Such an unstable sample may not be suitable for measurement by DLS. A more suitable solvent may prevent dissolution and hence stabilize the sample.
Removal of the sedimenting particles by filtration or centrifugation will improve the suitability of the sample to DLS measurement. Particle sedimentation will also give an in range warning message as discussed in Test 8 above.
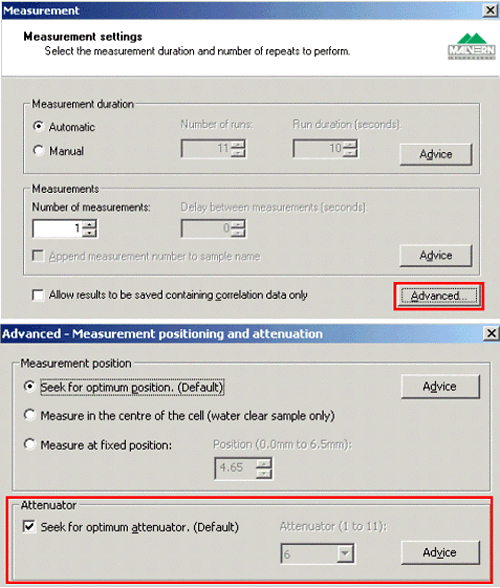
The final reason for this warning message may be that the attenuator setting is not set to automatic and an inappropriate setting has been used where the attenuation of the laser beam is too high. It is recommended that the instrument be allowed to select the optimum attenuator position. This default option of selecting the optimum attenuator position is accessed by clicking the Advanced Button on the Measurement Settings tab either when creating an SOP or setting up a Manual Measurement (figure 11). Checking the Seek For Optimum Attenuator option in the Advanced – Measurement Positioning and Attenuation window ensures that a count rate as close to 300kcps will be used (if this is achievable).
|
Count rate is out of range
This test is similar to 9a with the exception that it tests whether the scattering detected is too high.
One reason for a warning message is that an inappropriate attenuator setting has been used (too low an attenuation). This can be rectified in the same way as discussed in Test 9a above and shown in figure 11.
Other reasons for a warning message with this test are sample related. The sample may contain large particles that cause high levels of scattering and these will need to be removed by allowing them to naturally sediment with time or by filtering or centrifuging the sample. Alternatively the sample may be slowly aggregating with time causing an increase in the scattering intensity. If this is the case, the dispersion needs to be stabilized in some way (e.g. addition of surfactant, adjustment of pH etc).
Insufficient signal collected
This test checks that sufficient data has been collected. There are three possible reasons for obtaining a warning with this test and they are all related to incorrect settings in the software.
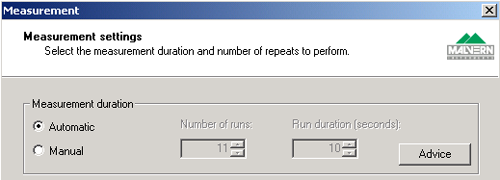
Firstly, the measurement duration may have been manually set to an inappropriate value. The default option of automatically allowing the software to determine the optimum measurement duration is recommended. This is done by selecting the Automatic Measurement Duration in the Measurement Settings window when setting up a Manual Measurement or creating an SOP (figure 12).
|
Secondly, the attenuator position may be set at an inappropriate value. This can be changed as discussed in Test 9a above (figure 11).
Finally, the Filter Factor may not be set to the default value of 50%. This is only applicable to the research software. Each size measurement taken by the Nano is divided into a series of sub runs. The default Filter Factor value of 50% means that only half of the sub runs taken are used in the final data analysis. The criterion for deciding which sub runs are selected is the mean count rate. The 50% of sub runs with the lowest mean count rates are the ones that are used in the analysis. This strategy is designed to minimize the effects of any dust contamination that may be present. If the Filter Factor has been manually set to an inappropriate value, insufficient data may have been used in the analysis.
A record can be edited so that more of the sub run data is used. This is done by selecting the relevant record in the Record View and edited (by clicking on Edit, Edit Result). This action brings up the Edit Result window. The Update Size Model option needs to be selected on the Size Analysis tab. Clicking on the Advanced button allows the Advanced Analysis Settings to be accessed (figure 13). Clicking on the Update Filtering option allows the Filter Factor to be changed to an appropriate value (figure 14). A new record will be calculated with these new settings implemented and will be displayed in the Record View.
|
|
Cumulants fit error high
The cumulants analysis derives the z-average diameter and polydispersity index as defined in the International Standard ISO22412. The cumulants fit error is a measure of the quality of the cumulants fit to the measured data indicating whether the z-average diameter and polydispersity obtained for a particular measurement are reliable values.
A warning message is obtained with this test if the fit error is greater than 0.005. This may be due to the data quality being too poor or that the sample is too polydisperse for the cumulants analysis. Figure 7 shows a correlation function obtained from a sample consisting of a broad size distribution containing large, sedimenting particles. This is a good example of a sample not suitable for the DLS technique. A cumulants fit error message is obtained with this sample.
Figure 15 shows the correlation function and the intensity size distribution obtained for a bi-modal sample. The size quality report has given a cumulants fit error indicating that the z-average diameter (301nm) is not reliable in this example. The cumulants and distribution fits are shown in figure 16.
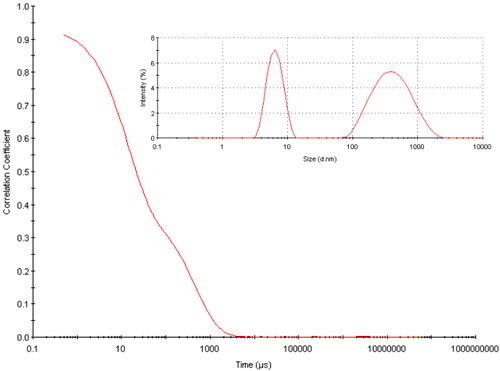
|
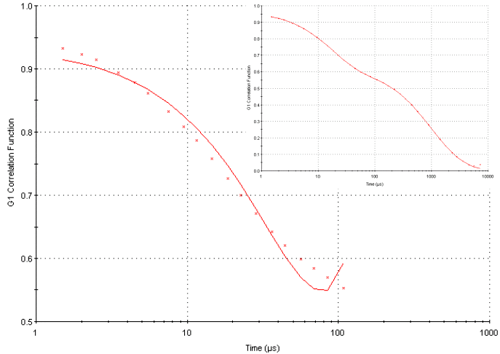
|
Whereas the cumulants fit is poor due to the bimodality of the sample, the distribution fit is excellent. Therefore, even though the z-average diameter for this record is not reliable, the intensity size distribution obtained from the distribution analysis is accurate.
Another reason for obtaining a cumulants fit error is inappropriate settings being used in the cumulants analysis. This is only applicable to the research software. If this is the case, the record can be edited by selecting the relevant record in the Record View and by clicking on Edit, Edit Result. The Update Size Model option needs to be selected on the Size Analysis tab in the Edit Result window. This allows the Advanced Settings of the Cumulants Analysis to be accessed (figure 17). After the settings are edited to more appropriate values, a new record will be created with the edited settings in the Record View.
|
Multimodal fit error high
The distribution fit error is a measure of the quality of the chosen distribution analysis fit to the measured data. In the standard Nano software, the distribution analyses that can be used are General Purpose and Multiple Narrow Modes. In the research version of the software, CONTIN and Discrete Exponential Analysis are also available.
A warning message is obtained with this test if the fit error is greater than 0.005. This may be due to the data quality being too poor or that the sample is too polydisperse suggesting that the sample may not be suitable for the DLS technique. An example of such a sample is given in figure 7. This sample will give warning
messages for the cumulants fit, the distribution fit, the in range test, the correlation function intercept test and the polydispersity index test.
Inappropriate settings in the chosen distribution algorithm can also cause a distribution fit error message. However, this is only applicable to the research software. More appropriate settings can selected by editing the relevant record in the Record View (by clicking on Edit, Edit Result). The Update Size Model option needs to be selected on the Size Analysis tab in the Edit Result window. After the appropriate distribution analysis model has been selected (General Purpose, Multiple Narrow Modes or CONTIN), more suitable settings can be edited in the chosen distribution analysis tab (figure 10) and a new record will be created in the Record View.