Protein aggregation is recognised as a major issue in the biopharmaceutical industry. Proteins have a tendency to aggregate over time and the risk for biologic drugs is that the presence of aggregates will stimulate an immune response. Size-exclusion chromatography (SEC) is a powerful tool that is commonly used to look at the aggregation of proteins.
SEC separates proteins by size. It is commonly used to measure their molecular weight and characterise aggregation. While most SEC systems use a single concentration detector such as ultraviolet (UV), the addition of light scattering allows the measurement of the molecular weight of the protein independent of its retention volume. The molecular weight of the protein monomer, oligomers and aggregates in a sample can then be measured to understand its behaviour. Multi angle light scattering (MALS) can also be used to measure the radius of gyration (Rg) of molecules that scatter light anisotropically (unevenly with respect to angle).
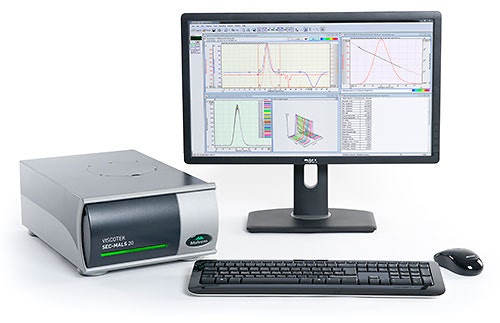
The Viscotek SEC-MALS 20 system (figure 1) is a 20 angle light scattering device capable of measuring the molecular weight of protein and protein aggregates independent of elution volume. The addition of further detectors such as concentration detectors (RI, UV), intrinsic viscosity (IV) and dynamic light scattering (DLS) can greatly increase the amount of information available from a single SEC measurement. In this application note, a selection of proteins are separated using SEC. The molecular weights of their oligomers and aggregates are measured by SEC-MALS and the results discussed.
|
The SEC-MALS 20 system was connected to a Viscotek TDAmax system using the TDA RI detector to measure concentration. Samples were separated using 2 x Viscotek protein columns. The mobile phase was phosphate-buffered saline and all the samples were dissolved in the mobile phase. The SEC-MALS system was calibrated using bovine serum albumin, a protein with a well characterised molecular weight. The detectors and columns were all held at 30°C to ensure a good separation and maximise baseline stability of the detectors.
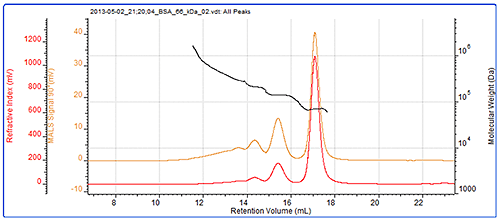
Samples of BSA are typically a mixture of monomer, oligomers and larger aggregates. Here, monomer, dimer and trimer peaks are clearly visible and their molecular weights have accurately been measured by MALS. The sample also contains some more polydisperse higher order aggregates that are not individually resolved. The BSA chromatogram can be seen in figure 2 and the results from the BSA measurement can be seen in table 1.
|
| Aggregates | Trimer | Dimer | Monomer | |
|---|---|---|---|---|
| Peak RV - (ml) | 13.84 | 14.31 | 15.37 | 17.05 |
| Mn - (kDa) | 337.3 | 199.4 | 133.6 | 66.1 |
| Mw - (kDa) | 378.3 | 201.2 | 133.9 | 66.3 |
| Mw/Mn | 1.122 | 1.009 | 1.003 | 1.002 |
| Rg(w) - (nm) | N/C | N/C | N/C | N/C |
| Wt Fr (Peak) | 0.04 | 0.057 | 0.423 | 0.745 |
The molecular weights across the monomer, dimer and trimer peaks are clearly seen to be very stable. This is expected with proteins which individually have very tightly controlled molecular weights and are considered to be monodisperse. While these molecular weights are stable, indicating that these are oligomers, the molecular weight trace is more variable in the earliest eluting material that is made up from a more polydisperse population. This is more typical of denatured aggregates which are likely to no longer be functional. The fraction of the total sample in each peak is identified in the 'Wt Fr' row.
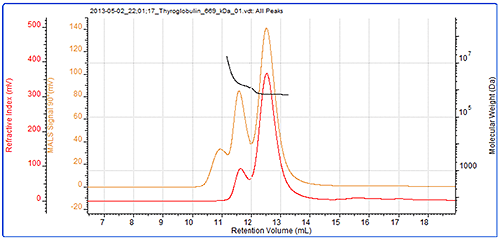
The second protein studied was thyroglobulin and its chromatogram can be seen in figure 2. The MALS signals from the different angles can be seen in the MALS plot in figure 3 and the calculated results can be seen in table 2.
|
|
| Aggregates | Monomer | |
|---|---|---|
| Peak RV - (ml) | 11.60 | 12.50 |
| Mn - (kDa) | 1601.0 | 681.5 |
| Mw - (kDa) | 2588.0 | 686.0 |
| Mw/Mn | 1.617 | 1.007 |
| Rg(w) - (nm) | N/C | N/C |
| Wt Fr (Peak) | 0.167 | 0.833 |
The thyroglobulin sample has been separated into 2 peaks according to the RI detector but 3 according to the SEC-MALS detector. The SEC-MALS detector is identifying a very small amount of very large aggregates that are only just visible to the RI detector.
The molecular weight of the monomer has been measured at 686 kDa. This is within 3% of the 669 kDa molecular weight of thyroglobulin. This is stable across the peak indicating this population is monodisperse. The aggregate peaks, which have been analysed as a single component, show a higher and more variable (polydisperse) molecular weight clearly identifying them as some disordered aggregates. It is unlikely that any of the proteins in this peak will have any activity and if it were a drug sample, these aggregates would be very likely to be immunogenic. The aggregates account for approximately 17% of the sample. It is worth noting that despite the high molecular weight of this protein, the SEC-MALS display clearly shows that the scattering from the monomer and the aggregates is isotropic. As such, it is not possible to measure the Rg of any of the peaks in this sample.
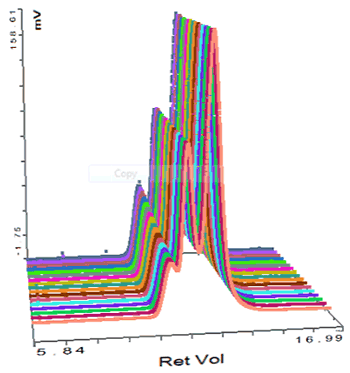
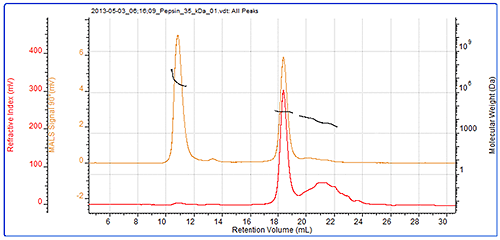
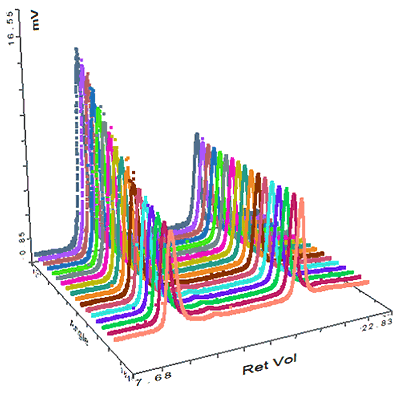
The final sample measured was pepsin and its chromatogram can be seen in figure 4. The SEC-MALS signals from the different angles can be seen in the MALS plot in figure 5 and the calculated results can be seen in table 3.
|
|
| Aggregates | Monomer | Degradation products | |
|---|---|---|---|
| Peak RV - (ml) | 10.84 | 18.33 | 20.92 |
| Mn - (kDa) | 3892.0 | 34.4 | 4.7 |
| Mw - (kDa) | 4431.0 | 34.7 | 6.4 |
| Mw/Mn | 1.138 | 1.008 | 1.364 |
| Rg(w) - (nm) | 69.9 | N/C | N/C |
| Wt Fr (Peak) | 0.008 | 0.569 | 0.423 |
The pepsin sample has been separated into 2 main peaks. The molecular weight of the second peak is measured at 34.7 kDa which is very close to known molecular weight of pepsin of 35 kDa. The larger peak has a much higher and more variable molecular weight clearly identifying it as some disordered aggregates which are unlikely to be active. Despite being such a large light scattering peak, the aggregates account for less than 1% of the total material in the sample. In this case, the MALS plot shows that these aggregates are strongly anisotropic scatterers. This means that their Rg can actually be measured, and is shown in the table to be nearly 70 nm. Pepsin has a nonglobular structure which means that it is larger than generally expected for a protein of that molecular weight. The size of the aggregate shows that the structure actually persists in the aggregates, which then become very large. This compares with the thyroglobulin aggregates which were much smaller (<15 nm) despite being over half the molecular weight of the pepsin aggregates. The pepsin monomer is too small for the measurement of Rg.
There is a third peak in the sample which is quite poorly defined but it is possible to measure its molecular weight as approximately 6 kDa. As a digestive enzyme, it is quite likely that this pepsin sample is digesting itself and that this represents some of the digestion products.
This application note has shown the successful measurement of the molecular weight and aggregate content of a number of proteins using the Viscotek SEC-MALS 20 system. This instrument can measure protein molecular weight independent of a protein's elution volume or structure. The molecular weight of BSA oligomers and thyroglobulin and pepsin aggregates were successfully measured and their amounts quantified. Where the aggregates are large enough, their size (Rg) can also be measured.