This note discusses how DLS-based optical microrheology can be used to determine the rheological behavior of polymer solutions and the impact of tracer particle chemistry on the measured microrheological response.
Enhanced Oil Recovery (EOR) is gaining increasing attention due to the shortage of current oil resources and difficulties in finding a new oil field. With traditional methods, only about 20%-40% of oil is extracted from a newly drilled oil reservoir leaving 60%-80% oil in the reservoir. With EOR technology, an additional 20% oil can be obtained from the reservoir. Polymers, especially surfactant and hydrogel polymers play an important role in the application of EOR technology [1]. The most common polymer used for this application is from the polyacrylamide group. These EOR fluids are used to implement polymer flooding - the injection of a solution into porous rock surrounding a drilled well, to recover residual oil.
The rheological properties of the EOR fluid play a critical role in the overall performance of these fluids. Quick rheological measurements over a wide frequency range are often required. In addition, especially in the case of newly synthesized polymers which are being tested for EOR applications, sample volumes available for testing are limited. Microrheology, which involves tracking the motion of dispersed tracer particles of known size by Dynamic Light Scattering (DLS), is a new and emerging technique that can be utilized to further scope the rheological performance of enhanced oil recovery (EOR) fluids such as hydrolyzed polyacrylamide and xanthan gum solutions. An additional benefit is that only small volumes of sample are required to give access to a rheological response over a wide frequency range [2, 3].
Optical DLS-microrheology uses tracer probe particles to measure the relationship between stress and deformation in materials. This passive microrheological technique utilizes the Brownian motion of tracer particles thereby applying very little stress on the fluids [2]. The sensitivity of the colloidal probe’s motion to the rheological state of the suspending medium can be effectively utilized to extract information about the rheological properties of complex fluids, such as the elastic modulus G’ and viscous modulus G” [4, 5]. Insights into the thermal motion of the probe particles can be quantitatively gained through the mean squared displacement (MSD) of the probe particles.
In a DLS experiment the autocorrelation function (g (t)) of the scattered light can be expressed as a function of the MSD of the scatterers (Δr2) with time [6]. The MSD of probe particles embedded in the system of interest can be calculated by performing a DLS experiment, and the Generalized Stokes-Einstein Relation (GSER) utilized to obtain the complex modulus of the medium as a function of angular frequency [6]. The complex viscosity can then be obtained from the complex modulus along with the elastic and viscous moduli [6].
This approach is starting to gain increasing popularity as a possible high-throughput methodology for obtaining viscosity for proteins [7] and viscoelasticity of complex fluids [8] and biological samples [9]. Despite the growing popularity of microrheological techniques, there are significant technical challenges including the choice of the correct tracer particles and the surface chemistry to probe the rheological response.
A key aspect to measuring the rheological response through DLS-based optical microrheology is ensuring the domination of the scattering signal by the added tracer particles over the network scattering. Additionally, significant chemical or physical interactions between the embedded probe and the surrounding material can measurably alter the local material environment and affect diffusivity, hence must be avoided. An appropriate choice of particle surface chemistry for the particular complex fluid solution is therefore essential to ensure extraction of the correct rheological response.
In general, chemical interactions between tracers and protein networks or complex fluids cannot be ignored and introduce large ambiguities in the interpretation of network responses. When the chemical interactions between the tracers and polymers are negligible, it is possible to characterize tracer motions based only on the size of the probe relative to the native structural sizes of the network. It has been demonstrated for proteins that PEG-coated colloids adsorb significantly less protein than uncoated ones or probes coated with physisorbed BSA [10].
Here we perform DLS-based optical microrheology and DLS measurements to measure viscoelastic properties of a polymer, as a comparative study between PEGylated and non-PEGylated tracer particles. Our results clearly indicate that due to steric effects, the PEGylated particles do not absorb polymers and as a result, produce bulk material properties. Additionally the study has successfully validated that with this method, rheological characterization using just a small amount of sample (as little as 20 μL) is possible. This permits rheological characterization of material that is not available in larger volumes, e.g. protein-based formulations or newly synthesized polymers/materials in the very earliest stages of development.
FLOPAAM 3230s polymer (Polyacrylamide powder supplied by SNF Floerger) with a molecular weight ranging between 6-8 MDaltons was hydrolyzed by deionized (DI) water to get a final concentration of 1 mg/ml. Polystyrene microspheres with NH2 coated (considered as No PEG) on the surface and another set of Polystyrene coated with PEG 300 with a diameter of 1 µm were used as tracers for the DLS-microrheology measurements, which were performed on a Zetasizer Nano ZSP. A sufficient concentration of tracers was added to each sample to ensure dominant scattering over the polymer. This criterion was considered to have been met when the particle size distribution determined by the instrument, contained a single peak attributable to the tracer particles. In this case 9 µL of the tracer suspension in 291 µL of sample, which makes a final concentration of 1.5 µg/mL of the mixture was found to be sufficient.
DLS (nanoscale particle size) measurements were performed using a Malvern Instruments Zetasizer Nano ZSP using the non-invasive back-scattering (NIBS) [11] configuration. The NIBS configuration uses a scattering angle of 173o and a moving lens arrangement. It is necessary to ensure that the measurement is performed in the single scattering regime. A Zetasizer Nano Helix cell (Figure 1) filled with only 170 µL of sample was used, which is significantly less compared to the minimum required amount of sample (nearly 500 µL) for traditional mechanical rheometry. For the FLOPAAM 3230s solution, the particle size distribution was measured after the addition of particles to ensure that the particle scattering dominates and that the particles are well dispersed.
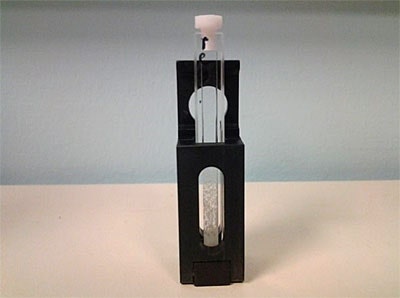
Figure 1: Zetasizer Nano Helix Cell filled with FLOPAAM 3230s solution.
When making DLS-microrheology measurements one of the important concerns is to check whether the probes are dispersed properly and not aggregated. To ensure this, the PSD was assessed to make sure that a narrow peak was present in a position corresponding to the size of the probes. This same inspection will confirm whether the scattering signal is dominated by the probe scattering or whether there is significant contribution from the network. Figure 2 shows the PSD of the Polystyrene probes at 25 °C for both the PEGylated and non-PEGylated (with NH2) probes in FLOPAAM 3230s polymer solutions. We see for PEGylated probe (blue color), the scattering from the probes dominate completely and the Z-average value (894.3 nm) is very close to the actual size of the probe. The narrow peak indicates that the probes are well dispersed and not aggregated. For non-PEGylated one (red color), some scattering from the network is starting to show, as was expected due to the chemical interaction between the tracers and the polymer networks.
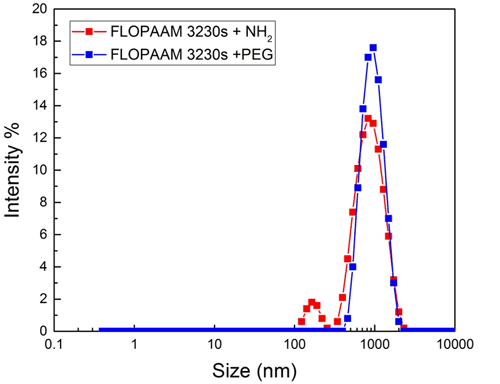
Figure 2: The measured PSD distribution of FLOPAAM 3230s samples with 1000 nm Polystyrene probes (blue and red colors for PEGylated and non-PEGylated probes respectively) at 25°C.
One of the main requirements for microrheological measurements is that the particle–matrix interactions must be minimized. The impact of the interaction/coating on the extracted microrheological response is further investigated and discussed through studies on PEGylated and non-PEG (NH2) polystyrene particles. The effect of the particle chemistry on the extracted elastic modulus has been investigated on the FLOPAAM 3230s sample utilizing the polystyrene particles at 25°C. Figure 3 shows that the elastic moduli G’ extracted utilizing the PEGylated polystyrene particle has a good agreement with the G' found from the traditional mechanical rheometer measurement and exhibits a significant difference with the non-PEG particles.
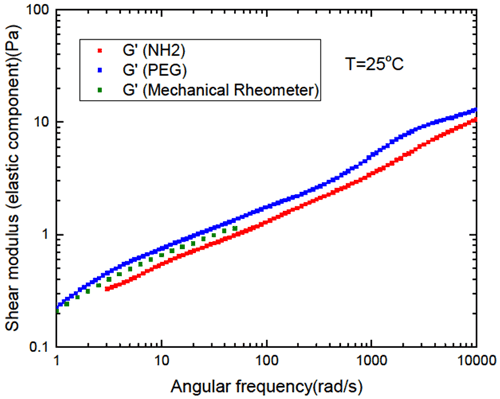
Figure 3: Comparison of G’ obtained using PEG and Non-PEG polystyrene particles at 25oC in 1 mg/mL FLOPAAM 3230s solutions.
The complex viscosity has also been extracted and compared with mechanical rheometry and non-PEG particles in Figure 4. It is clearly shown that polymer sample with PEGylated particles give comparable complex viscosity with the mechanical rheometer measurement, while the non-PEGylated (NH2) polystyrenes particles results in a greater deviation from the mechanical rheometry data.
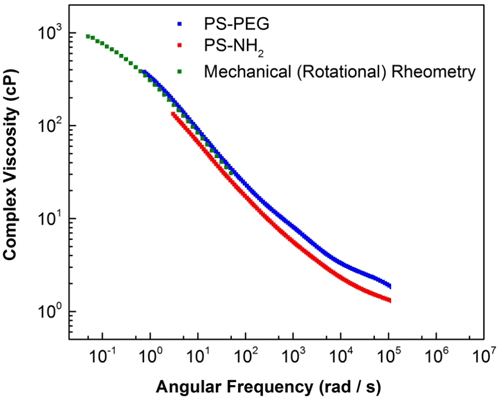
Figure 4: Comparison of complex viscosity obtained using PEG and Non-PEG (NH2) polystyrene particles at 25oC in 1 mg/mL FLOPAAM 3230s solutions
DLS and DLS-based optical microrheology has been used to determine the impact of particle surface chemistry on polymer microrheology and on particle size distribution. The tracer particle chemistry was seen to significantly impact the obtained microrheological response. The PEGylated polystyrene particle seem to have significantly less chemical interactions with the polymer solution compared to the unmodified (NH2 coated) polystyrenes particles. The complex viscosity and elastic modulus found from the polymer solution with this PEGylated particles compare well with the values obtained from the mechanical rheometry data, confirming that with a correct choice of tracer particles, the DLS microrheology can be used to measure the viscoelastic properties of various polymer series as well as other complex fluids. The above described study can be done for other promising polymers used for the advancement in oil recovery technology.
A. Z. Abidin et al; Procedia Chemistry 4 (2012) 11 – 16.
Amin, S, Rega, C and Jankevics, H "Detection of viscoelasticity in aggregating dilute protein solutions through dynamic light scattering-based optical microrheology" Rheologica Acta, 51, 1-14 (2012).
Hincapie, R.E, Duffy J, O’Grady C, Ganzer, L; An Approach to Determine Polymer Viscoelasticity under Flow through Porous Media by Combining Complementary Rheological Techniques; SPE EOR Conference, Malaysia (2015).
Mason TG, Weitz DA (1995) Optical measurements of frequency dependent linear viscoelastic moduli of complex fluids. Phys Rev Lett 74:1250–1253.
Mason TG (2000) Estimating the viscoelastic moduli of complex fluids using the generalized Stokes–Einstein equation. Rheol Acta 39:371–378.
Malvern Application note: Determination of protein solution viscosity using DLS microrheology.
He F, Becker GW, Litowski JR, Narhi LO, Brems DN, Razinkov VI (2010) High-throughput dynamic light scattering method for measuring viscosity of concentrated protein solutions. Anal Biochem 399:141–143.
Breedveld V, Pine DJ (2003) Microrheology as a tool for highthroughput screening. J Mater Sci 38:4461–4470.
Schultz KM, Baldwin A, Kiick KL, Furst EM (2009) Rapid rheological screening to identify conditions of biomaterial hydrogelation. Soft Matter 5:740–742.
M. T. Valentine et al; Biophys J.; 86(6): 4004–4014, June, 2004.
Peters R (2000) Fiber optic device for detecting the scattered light or fluorescent light from a suspension. US Patent No 6,016,195.