
To improve its shelf-life, milk undergoes a homogenization process. This process produces fat globules of a uniform, small size. During the homogenization process the size range of the fat globules is reduced from 0.1-15 μm in unprocessed milk to 1-2 μm in homogenized milk [1]. These smaller globules cannot form large enough clusters for creaming to occur, increasing the shelf-life of the milk. The creaming process is governed by Stokes’ Law and the relative densities of the fat and the other fluid components of the milk. Milk also contains casein micelles, in the size range of 0.05-0.25 μm. The micelles play a role in stabilizing the fat globules, especially after the homogenization process. The size of the fat globules and the proportion of free casein micelles are important parameters for monitoring the homogenization process and can be measured simultaneously by laser diffraction.
To improve its shelf-life, milk undergoes a homogenization process. This process produces fat globules of a uniform, small size. During the homogenization process the size range of the fat globules is reduced from 0.1-15 μm in unprocessed milk to 1-2 μm in homogenized milk [1]. These smaller globules cannot form large enough clusters for creaming to occur, increasing the shelf-life of the milk. The creaming process is governed by Stokes’ Law and the relative densities of the fat and the other fluid components of the milk.
Milk also contains casein micelles, in the size range of 0.05-0.25 μm. The micelles play a role in stabilizing the fat globules, especially after the homogenization process. The size of the fat globules and the proportion of free casein micelles are important parameters for monitoring the homogenization process and can be measured simultaneously by laser diffraction.
Homogenized milk is an oil-in-water emulsion containing:
The fat globules and casein micelles contribute to the particle size distribution measured by laser diffraction {Figure 1}. The lactose, whey, vitamins and minerals are present in solution and so do not contribute.
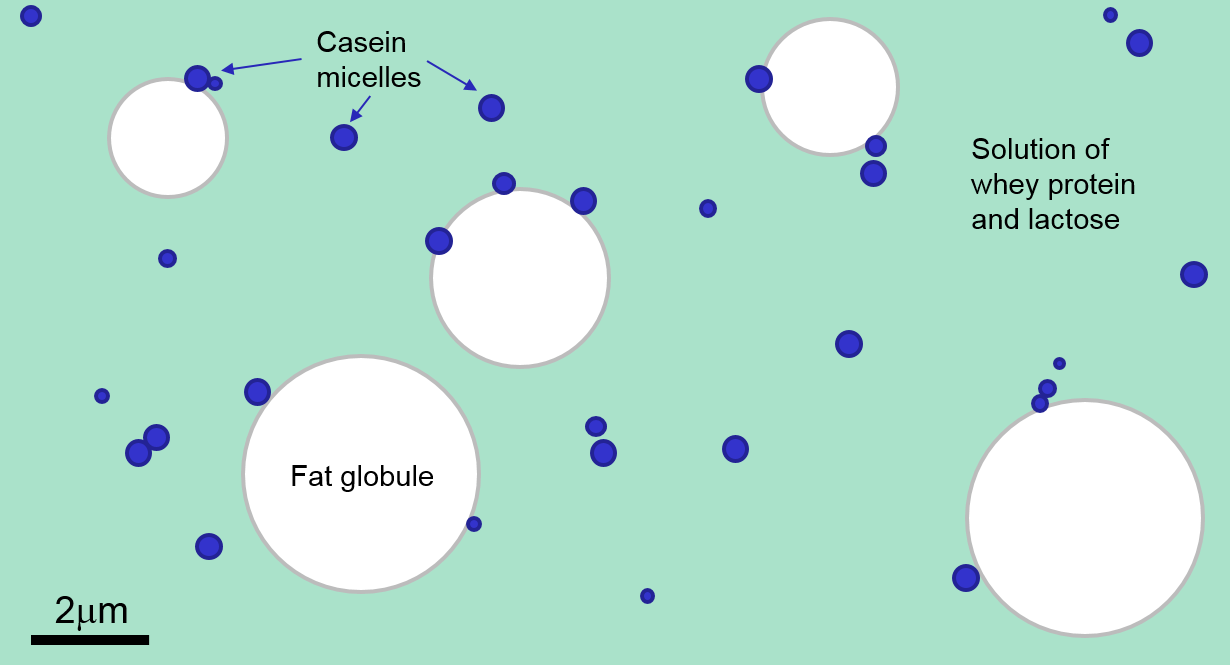
Figure 1: From a laser diffraction perspective, milk consists of fat globules and casein micelles in a solution of whey protein and lactose.
In this application note, three UK drinking milks with different fat contents {Table 1} were measured and the particle size distributions compared. A further experiment was performed by removing the casein micelles from the milk to confirm how the casein micelles and fat globules contribute to the measured particle size distributions.
| 5.5% fat | 3-4% fat | 2% fat | 1% fat | 0-0.5% fat |
|---|---|---|---|---|---|
UK | Channel island | Whole or full cream | Semi-skimmed | 1% milk | Skimmed |
USA | N/A | Whole or regular | 2% milk or reduced fat | 1% milk or low fat | Skim or nonfat |
Table 1: Fat contents in different grades of drinking milk available in UK and USA.
The particle size distributions of three different grades of drinking milk were measured {Figure 2}. The particle size distributions can be interpreted in terms of the structure of milk.
The particles below 0.25 μm can be understood to be casein micelles and the particles at 1-2 μm can be interpreted as fat globules. The particles approaching 10 μm in the whole milk sample may be clusters of fat globules that have either survived the homogenization process, or formed subsequently. The proportion of fat globules, measured as the volume percentage above 0.25 μm, increases with the total fat content of the milk, with the casein micelles forming the remainder of the population {Table 2}. The largest particles are present in the whole milk, which has the highest fat content. The particle size distribution of the semi-skimmed milk represents an intermediate composition. The smallest particles are present in the skimmed milk, which contains only a trace of fat.
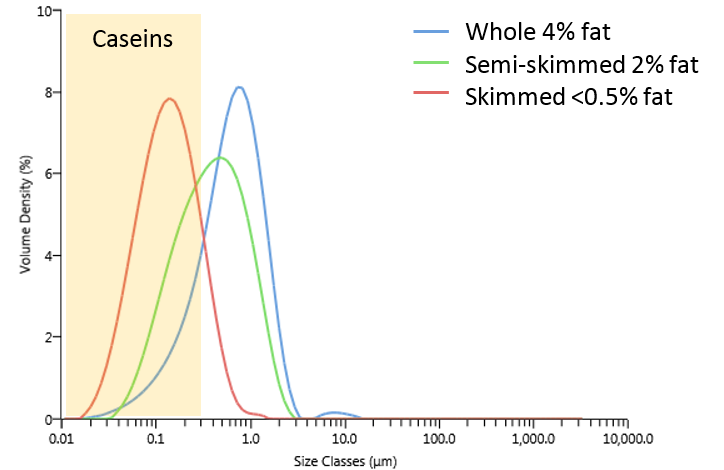
Figure 2: Particle size distributions of whole, semi-skimmed and skimmed milks. The particles below 0.25 μm are casein micelles, the particles at 1-2 μm are fat globules and the particles approaching 10 μm in the whole milk are clusters of fat globules.
| % above 0.25 μm | Dv10 (μm) | Dv50 (μm) | Dv90 (μm) |
|---|---|---|---|---|
Whole milk 4% fat | 84.17 | 0.179 | 0.635 | 1.502 |
Semi-skimmed milk 2% fat | 66.63 | 0.113 | 0.383 | 1.103 |
Skimmed milk <0.5% fat | 19.86 | 0.049 | 0.132 | 0.338 |
Table 2: The volume below 0.25 μm compared with the fat content of the drinking milks
There are trends in the data consistent with the presence of casein micelles below 0.25 μm and fat globules above 1 μm. To prove this interpretation, the casein micelles in the milk were disrupted using a solution of EDTA [3]. In this experiment the milk was pre-dispersed using the EDTA solution before it was added to the dispersion unit. The particle size distributions obtained from whole and semi-skimmed milk with and without the casein micelles are shown in Figures 3-4 and Table 3. In both cases, use of the EDTA solution increases the proportion of material above 0.25 μm. This supports the assertion that the material below 0.25 μm is casein micelles.
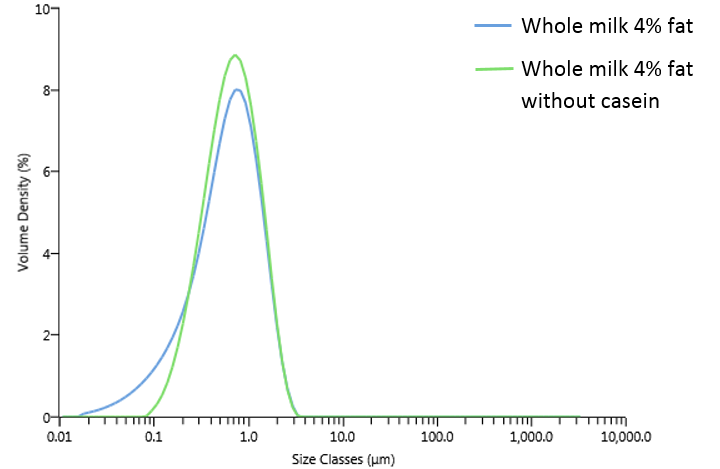
Figure 3: Whole milk with and without casein
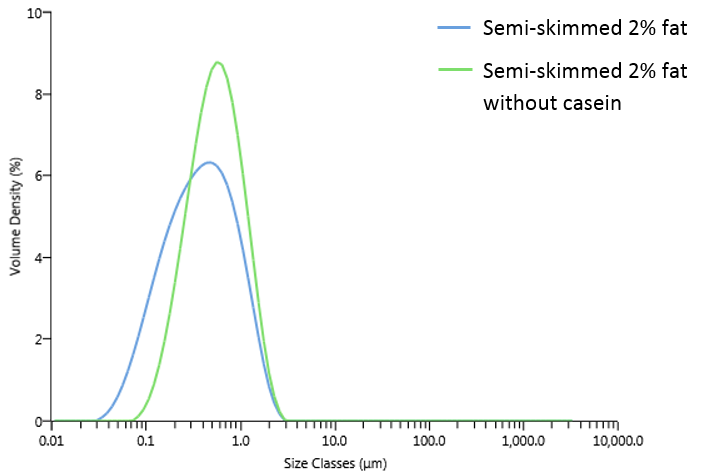
Figure 4: Semi-skimmed milk with and without casein micelles.
| % above 0.25μm | Dv10 (μm) | Dv50 (μm) | Dv90 (μm) |
|---|---|---|---|---|
Whole | 82.35 | 0.159 | 0.617 | 1.450 |
Whole no casein | 91.07 | 0.261 | 0.661 | 1.469 |
Semi-skimmed | 65.85 | 0.111 | 0.376 | 1.096 |
Semi-skimmed no casein | 86.34 | 0.220 | 0.543 | 1.237 |
Table 3: Particle size statistics for drinking milks with and without casein micelles.
Drinking milks can be measured by laser diffraction using Mastersizer 3000. The particle size distributions contain contributions from both casein micelles and fat globules, enabling the performance of the homogenization process to be assessed, monitored and controlled.
[1] Prof H Douglas Goff, Dairy Science and Technology Education Series, University of Guelph, Canada https://www.uoguelph.ca/foodscience/book-page/dairy-science-and-technology-ebook
[2] The Dairy Council, The nutritional composition of dairy products, http://www.milk.co.uk/page.aspx?intPageID=194
[3] CH McCrae & A Lepoetre, Characterisation of dairy emulsions by forward lobe laser light scattering – application to milk and cream, Int Dairy Journal 6 (1996) 247-256