Requirements to characterise manufactured nanomaterials (MNM) under relevant biological and environmental exposure conditions have been well established. This is key to understanding particle fate and behaviour and ultimately in determining the available MNM dose in toxicity assessments. Variations in media properties can significantly alter particle behaviour. This drives a need for technology capable of characterising particles in complex matrices. NTA presents a tool capable of meeting these requirements and is demonstrated with a series of experiments performend with a range of particle types in relevant biological and environmental media providing temporal data of suspension properties.
Requirements to characterise manufactured nanomaterials (MNM) under relevant biological and environmental exposure conditions have been well established. This is key to understanding particle fate and behaviour and ultimately in determining the available MNM dose in toxicity assessments1.
Variations in media properties can significantly alter particle behaviour once dispersed, presenting different size distributions dependent on organic content, pH, conductivity, etc. compared to sample reference buffers. This has been identified in both biological2 and representative environmental media3 and drives a need for technology capable of characterising particles in complex matrices. This need has been highlighted as an important end-point by the OECD nanomaterials sponsorship programme4.
Nanoparticle Tracking Analysis (NTA) represents a tool capable of meeting these requirements. The following Application Note describes experiments in collaboration with the EU FP7 funded NanoMILE project proving the ability of NTA to provide a unique insight into particle dose under relevant biological and environmental conditions. Measurements have been taken on a range of particle types in relevant biological and environmental media providing temporal data of suspension properties.
NTA utilizes the properties of both light scattering and Brownian motion to obtain the particle size distribution of samples in liquid suspension. A laser beam is passed through the sample chamber, and the particles in suspension in the path of this beam scatter light in such a manner that they can easily be visualized via a 20x magnification microscope and mounted camera. The camera, which operates at approximately 30 frames per second (fps), captures a video file of the particles moving under Brownian motion within the field of view of approximately 100 μm x 80 μm x 10 μm (Figure 1).

Figure 1: Schematic of the optical configuration used in NTA.
The movement of the particles is captured on a frame-by-frame basis. The proprietary NTA software simultaneously identifies and tracks the centre of each of the observed particles, and determines the average distance moved by each particle in the x and y planes. This value allows the particle diffusion coefficient (Dt) to be determined from which, if the sample temperature T and solvent viscosity η are known, the sphere equivalent hydrodynamic diameter, d, of the particles can be identified using the Stokes-Einstein equation (Equation 1).
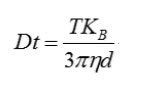
Equation 1: The Stokes-Einstein equation where KB is Boltzmann’s constant.
NTA is not an ensemble technique interrogating a very large number of particles, but rather each particle is sized individually, irrespective of the others. An example of the size distribution profile generated by NTA is shown in Figure 2.

Figure 2: An example of the size distribution profile generated by NTA. This 5-size mixture has a modal size approximately 100 nm, with addition sub-populations at approximately 165 nm, 225nm, 300nm and 400 nm also present.
In addition, the particles’ movement is measured within a fixed field of view illuminated by a beam allowing a scattering volume of the sample to be estimated. By measuring concentration of the particles within this field of view and extrapolating to a larger volume it is possible to achieve a concentration estimation in terms of particles per mL for any given size class or an overall total.
A series of experiments were planned using a NanoSight NS500 (HS, 532nm) to demonstrate the ability of NTA to provide unique time resolved data on particle behaviour. Particle material and representative media were identified based on selections from the NanoMILE consortium designed to represent a range of conditions.
Cerium (IV) Oxide (33nm, JRCa), Silver (100nm, Sigma-Aldrichb) and Titanium dioxide (70nm, NISTc) nanoparticles were dispersed in 10% Foetal bovine serum (FBS), phosphate buffer serum (PBS) and zebrafish embryo media (ZEM) replicating biological and environmentally representative conditions. The samples were then delivered by the NTA syringe pump and regular measurements made in an automated fashion over a 21hr period using NTA scripting functions. Videos were then processed at a suitable detection threshold.
a. CeO2 - http://publications.jrc.ec.europa.eu/repository/bitstream/JRC89825/lbna26649enn.pdfA key feature of NTA is the ability to provide concentration through particle number, enabling correlation with the agglomeration and sedimentation rates of particle suspensions.
All particle types studied show a drop in particle concentration over the 21 hr period regardless of test media, as shown in Figure 3 a-d. The first 60 minutes of the experimental period showed the sharpest decrease in concentration.

Figure 3: Graphs displaying concentration values for CeO2, TiO2 and Ag MNMs dispersed in a) Deionised water, b) 10% FBS, c) PBS and d) ZEM over a 21-hr duration.
Modal size distributions showed a high degree of variability for all three particle types and in all 4 media conditions, as shown in Figure 4a-d. Unsurprisingly, the largest sizes were observed with Ag MNMs in ZEM which has the highest ionic strength, although the size of the TiO2 MNMs appeared to decrease in ZEM over time, suggesting break-up of some agglomerates or sedimentation of larger agglomerates over time leaving a higher proportion of smaller particles in the region of analysis.

Figure 4: Graphs displaying size values for CeO2, TiO2 and Ag MNMs dispersed in a) Deionised water, b) 10% FBS, c) PBS and d) ZEM over a 21-hr duration.
Quantitative concentration measurements are supported by visualisation of the sample. Figure 5 Shows a randomly selected frame from each timepoint supporting the drop in concentration through reduced scattering objects. The presence of larger scattering agglomerated particles is also indicated through higher image noise.

Figure 5: Graphs displaying modal size values for CeO2, TiO2 and Ag nanoparticles dispersed in deionised water, PBS, 10% FBS and ZEM. Data displayed for first 60 minutes only.
Together, the concentration and size studies reported in Figures 3-4 have shown the ability of NTA to track and monitor the behaviour of MNMs in a range of media over extended periods in an automated routine. Concentration and size data has been provided which can be used to track temporal processes such as agglomeration and other changes to particles suspended in representative media to build an understanding of particle fate and behaviour beyond pristine conditions.
NTA successfully characterised particles in all three representative media types independent of particle material. Scattered light from the media constituents did not limit NTA’s ability to detect and track particles of the lowest refractive index (Ri) but instead plotted the evolution and interaction of nanomaterial within complex media. A marked difference in particle behaviour was seen across all conditions reinforcing the importance of characterising particles outside of pristine environments. This will have profound implications for dose estimates.
While sedimentation cannot be directly quantified, the gradual absence of particles over time can be attributed to settling of larger agglomerates (as shown qualitatively in Figure 5). The time resolved nature of this data in conjunction with the temporal resolution available with NTA ensures this technique holds value in understanding MNM behaviour over the time-course of typical in vitro assays with MNMs dispersed in the relevant media allowing the potential for direct correlation of dose with response. Quantitative data is supported by qualitative images allowing confirmation of results with visual inspection. Additionally video frames of MNMs over time allow some important qualitative conclusions to be reached regarding dispersion stability and evolution, as shown in Figure 5. Combining these outputs provides a valuable tool in indicating sample stability or the presence of aggregation, agglomeration or settling. This information could have important consequences for in vitro exposure whereby at later time-points the majority of MNMs may have agglomerated and settled onto the cell surfaces thereby facilitating uptake as potentially micron-scale agglomerates rather than nanoscale particles. This has consequences both for dose-response but also for the design of optimal in vitro exposure assays such that realistic exposure doses are maintained in solution.
Further developments within the NanoMILE project have introduced the NTA Auto-sampler. The automated nature and large batch capabilities now available to NTA provide increased relevance to understanding the toxicological impact and fate and behaviour of MNM beyond pristine conditions.
References:
[1] Dawson, K, A., Anguissola, S., Lynch, I., (2013) The need for in situ characterisation in nanosafety assessment: funded transnational access via the QNano research infrastructure. Nanotoxicology 7, 346-349.
[2] Moore, T, L., Rodriguez-Lorenzo, L., Hirsch, V., Balog, S., Urban, D., Jud, C., Rothen-Rutishauser, B., Lattuada, M., Petri-Fink, A., Nanoparticle colloidal stability in cell culture media and impact on cellular interactions. Chem. Soc. Rev 44, 6287-6305
[3] Tantra, R., Jing, S., Pichaimuthu, S, K., Walker, N., Noble, J., Hackley, V, A., (2011) Dispersion stability of nanoparticles in ecotoxicological investigations: the need for adequate easurement tools. J Nanopart Res DOI 10.1007/s11051-011-0298-y
[4] http://search.oecd.org/officialdocuments/displaydocumentpdf/?cote=env/jm/mono(2010)46&doclanguage=en

The work leading to these results has received funding from the European Union Seventh Framework Programme (FP7/2007-2013) under grant agreement no. NMP4-LA-2013-310451.