
The molecular characteristics of a macromolecule are important parameters to be determined as they all can affect the material’s physical properties and behavior in a final product as well as during processing. In order to measure and evaluate these parameters (molecular weight and molecular weight distribution, molecular size and structure) size exclusion chromatography (SEC), or gel permeation chromatography (GPC) as it is also known, is one of the most useful tools that can be used.
SEC is a liquid chromatography method that separates macromolecules according to their size (hydrodynamic volume) thus allowing further macromolecular characteristics to be derived from analysis of these separated fractions using various detectors. The number of parameters derivable from this technique strongly depends on the number and type of detector used or included in the SEC system. The Malvern Panalytical OMNISEC SEC system can have, as a multi-detection system, four different detectors: refractive index (RI) and ultraviolet (UV-Vis) detectors, also indicated as concentration detectors, light scattering (RALS/LALS – MALS) detectors, and viscometer detectors.
Please login or sign up to read more.
The molecular characteristics of a macromolecule are important parameters to be determined as they all can affect the material’s physical properties and behavior in a final product as well as during processing. In order to measure and evaluate these parameters (molecular weight and molecular weight distribution, molecular size and structure) size exclusion chromatography (SEC), or gel permeation chromatography (GPC) as it is also known, is one of the most useful tools that can be used.
SEC is a liquid chromatography method that separates macromolecules according to their size (hydrodynamic volume) thus allowing further macromolecular characteristics to be derived from analysis of these separated fractions using various detectors. The number of parameters derivable from this technique strongly depends on the number and type of detector used or included in the SEC system. The Malvern Panalytical OMNISEC SEC system can have, as a multi-detection system, four different detectors: refractive index (RI) and ultraviolet (UV-Vis) detectors, also indicated as concentration detectors, light scattering (RALS/LALS – MALS) detectors, and viscometer detectors.
For example, the use of at least three of these detectors in an OMNISEC system allows for the calculation of absolute molecular weight and molecular weight distribution, molecular size and structure (multi-detection method). The use of less than three detectors can result in a different number/type of information about the samples. The multi-detection setup is a powerful approach to SEC that uses an optimized detector calibration method (further details can be found here) to ensure accurate and reproducible data.
However, this is not the only way the multi-detection OMNISEC system can be used by scientists in order to characterize their samples. Before the introduction of light scattering detectors, the method used for the characterization of molecular weight distribution of samples has been a column calibration method(s). These methods have been omnipresent in SEC for many reasons such as:
With this in mind, Malvern Panalytical have recently introduced a series of new column calibration methods into the OMNISECTM software. This makes use of the OMNISEC system’s highly sensitive RI detector or the wide-ranging UV-Vis detector that allows samples to be analyzed using a conventional calibration method, or to be combined with the online-viscometer in a single detector suite to analyze samples with a universal calibration method.
The first SEC/GPC instrument was introduced in the mid-1960s(1) and it was in fact a SEC system that analyzed samples using a conventional calibration method. This first SEC instrument included one single detector, which was an RI detector, and used a calibration curve to extract the molecular weight distribution information from the samples. Nowadays, the SEC systems have improved dramatically, but the principle, methodology, and results of a conventional calibration method are still the same:
The conventional calibration method in the OMNISECTM software can be built from a series of either narrow or broad standards. They are differentiated by which molecular weight data is used. For a narrow standard, the molecular weight at peak (Mp) is used, whereas, the number average molecular weight (Mn), weight average (Mw) and Z-average (Mz) molecular weight are used for a broad standard.
Universal Calibration is another type of column calibration that can be used to calculate the molecular weight distribution of a sample and additional parameters. It is based upon a similar principle and methodology as conventional calibration:
Column calibration methods are based upon comparing the retention volume of standards and samples, but that is dependent on hydrodynamic volume/size. The principle upon which universal calibration is based, as stated above, is the use of a viscometer to account for the different size to molecular weight relationships of polymers in specific solvents. As the hydrodynamic volume is proportional to the product of Mw and IV, by comparing a sample’s retention volume and IV to the universal calibration curve the true or accurate molecular weight can be determined.
This application note shows an example of samples analysis performed by column calibration using the Malvern Panalytical OMNISECTM software V11.20. For this application note, a series of polystyrene (PS) standards have been run on a complete multi-detection OMNISEC system.
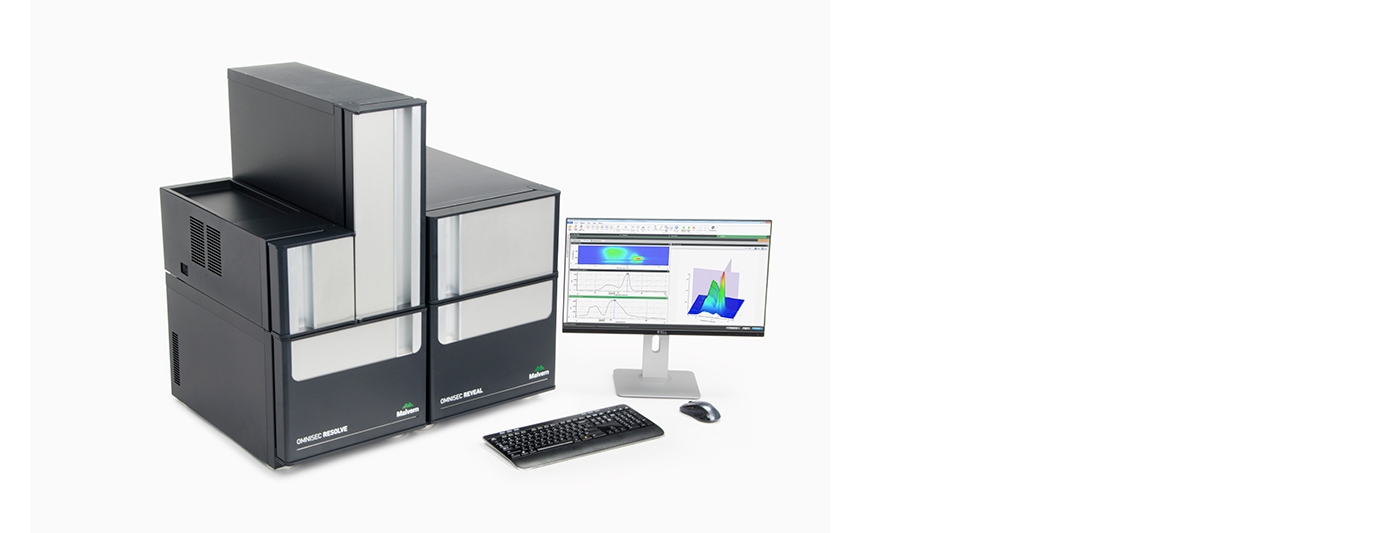
Figure 1. The OMNISEC system, comprising OMNISEC RESOLVE (left), OMNISEC REVEAL (right) and OMNISECTM software.
Standards and samples were measured by multi-detection SEC on a Malvern Panalytical OMNISEC system including RI, UV-Vis, RALS/LALS and viscometer detectors. The Malvern Panalytical OMNISEC system, shown in Figure 1, was set up as follows:
Columns: Malvern Panalytical columns T5000+T3000+T1000
Mobile phase: stabilized THF
Flow rate: 1.0 mL/min
Autosampler temperature: 25°C
Column oven temperature: 35°C
Detectors temperature: 35°C
All system control, data acquisition, data analysis and data reporting were performed using the OMNISECTM V11.20 software.
A series of narrow polystyrene (PS) standards with a wide range of molecular weight (eleven standards from 1.2 kg/mol to 4.2 Mg/mol) were used to make a column calibration method. The samples analyzed in this note are the following synthetic polymers: polymethylmethacrylate (PMMA), polyvinylchloride (PVC), polyisoprene (PI) and polybutadiene (PBd).
The chromatograms produced from the analysis of the column calibration standards are shown below in Figure 2. In this figure, the eleven PS standards are overlaid and compared in terms of RI and viscometer (DP) detector responses.
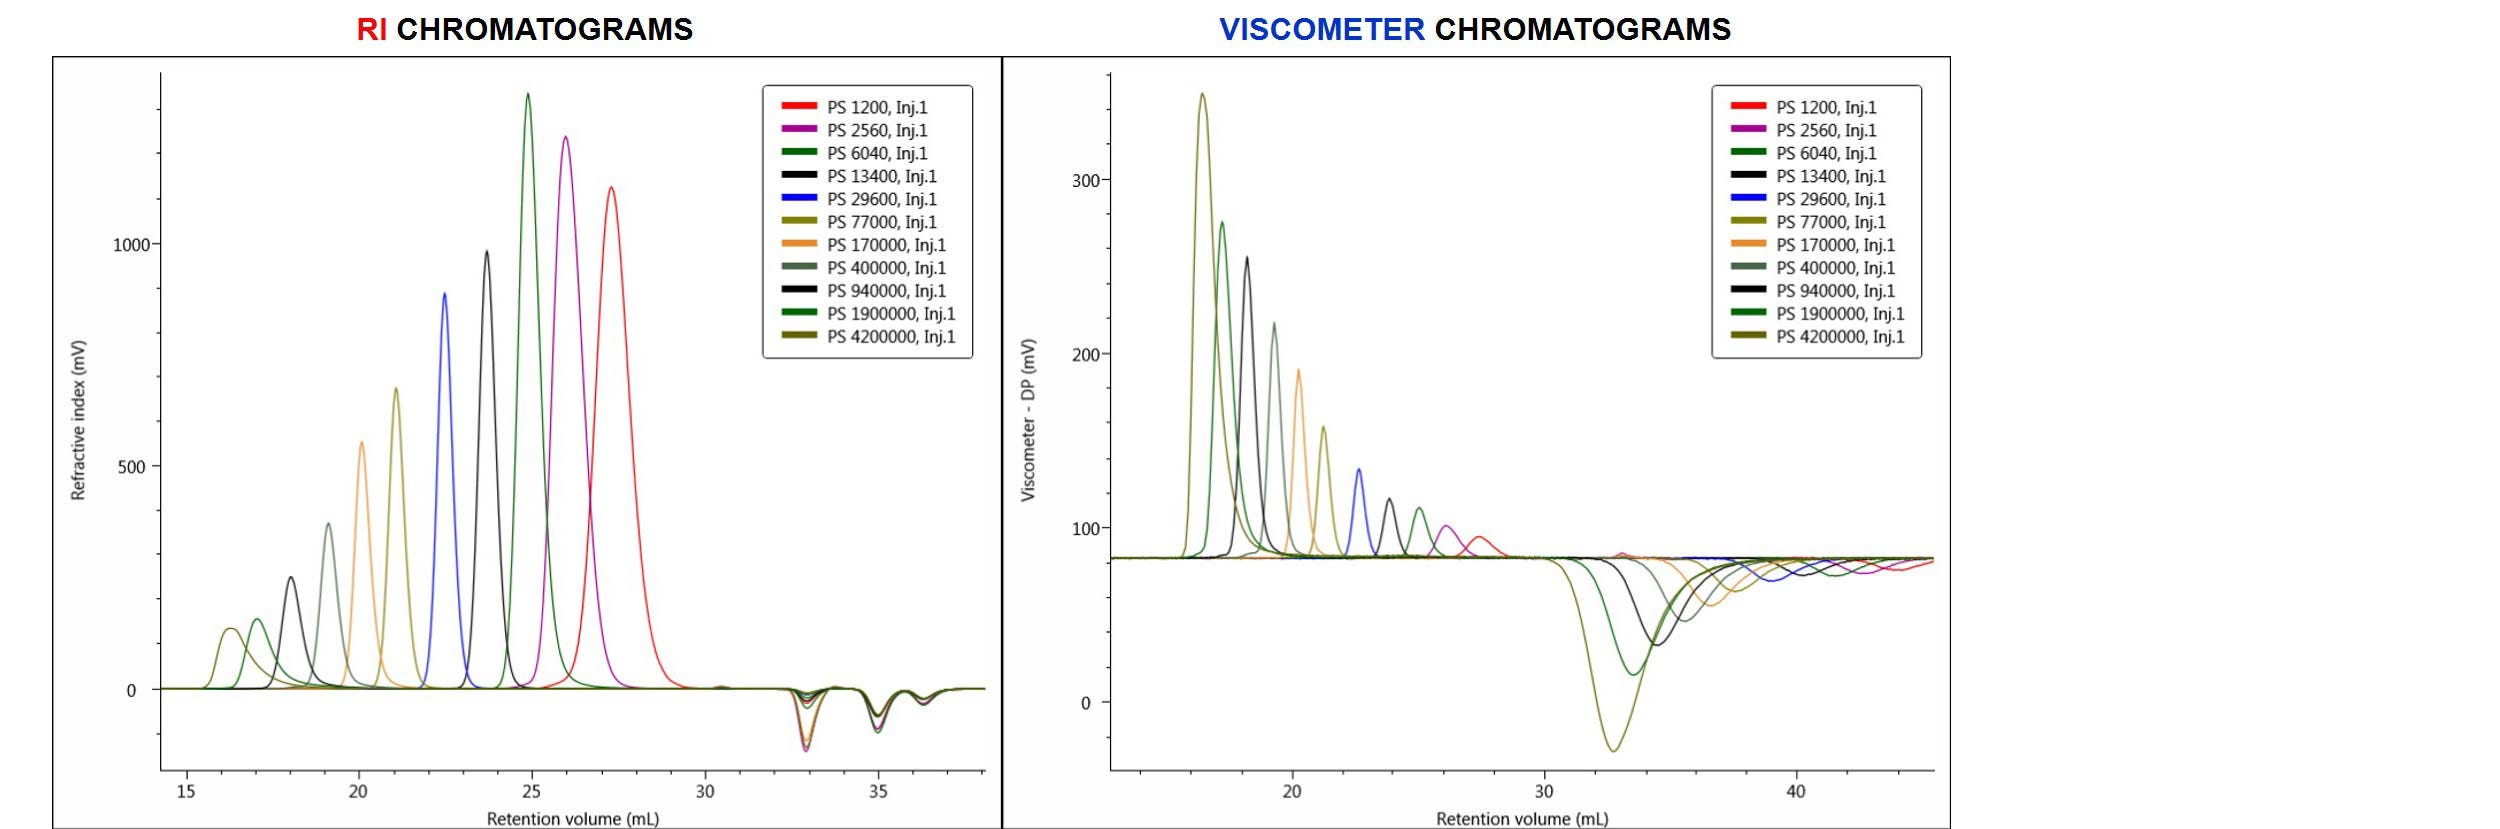
Figure 2. Overlay of RI chromatograms (on the left) and viscometer (DP) chromatograms (on the right) produced by injections of eleven PS narrow standards.
From the RI chromatograms shown above, a conventional calibration curve was built in the software by assigning the elution volume of each peak with the appropriate standard’s molecular weight (Mp). In performing a universal calibration method, both the RI and DP chromatograms were used and the universal calibration curve was built from both standards’ Mp and IV data.
The calibration curves resulting from the two methods are shown below in Figure 3.
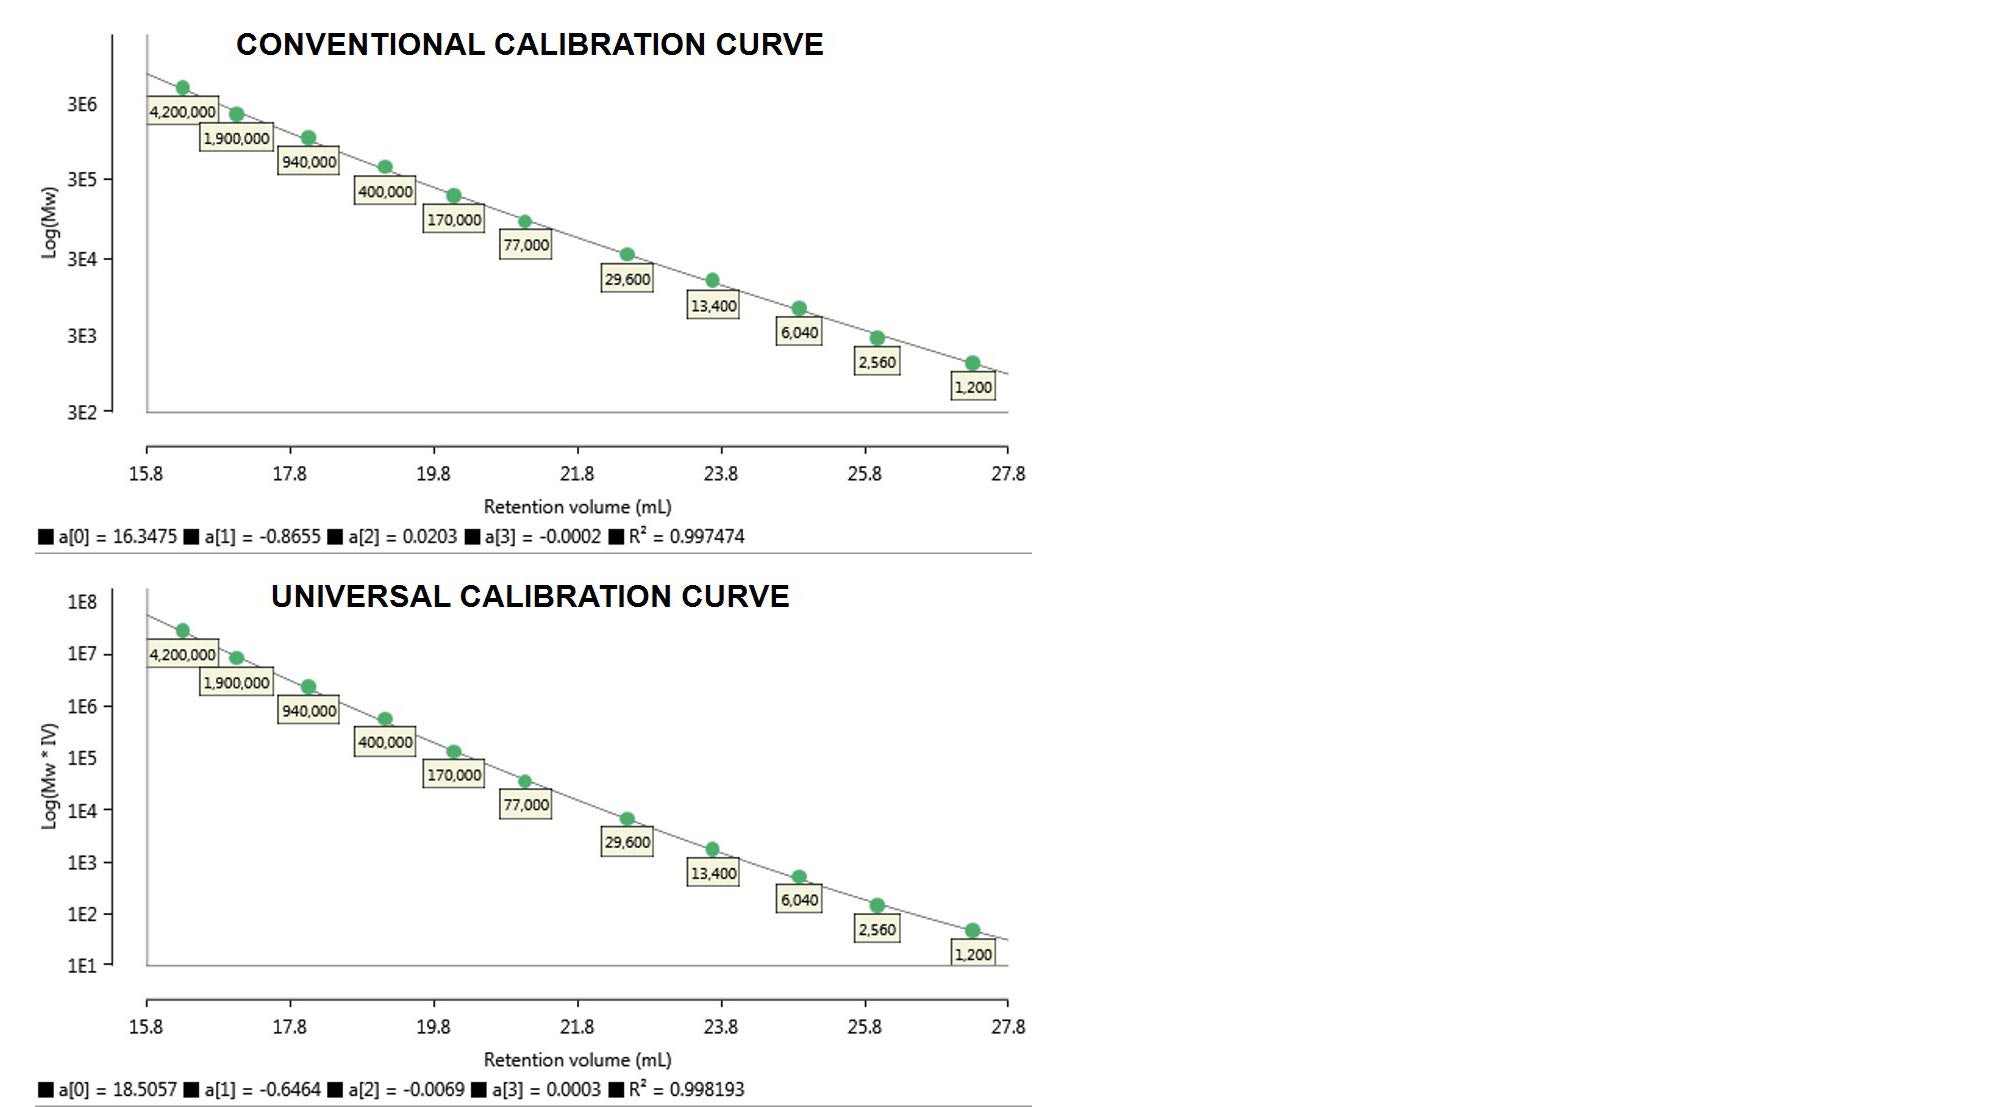
Figure 3. Column calibration curves made from the monodisperse PS standards discussed. Top: conventional calibration curve - Log(Mw) vs retention volume. Bottom: universal calibration curve - Log(Mw·IV) vs retention volume. Below each curve the calibration polynomial coefficients a[0-3] and R2 are reported.
In Figure 3 Log(Mw) and Log(Mw·IV) are each plotted against retention volume, the former representing a conventional calibration curve and the latter a universal calibration curve. For each of the calibration curves generated, the software provides polynomial coefficients used to fit the curve to the standards and its R2 value.
Once a column calibration method has been created, a calibration curve is used as a reference to calculate the sample results based on their retention volume.
For example, a known polymethylmethacrylate (PMMA) sample was run and analyzed with both conventional and universal calibration methods (CC and UC). The relevant detectors chromatograms for the PMMA sample and the calibration curves of the two different column calibration methods are shown in Figure 4.
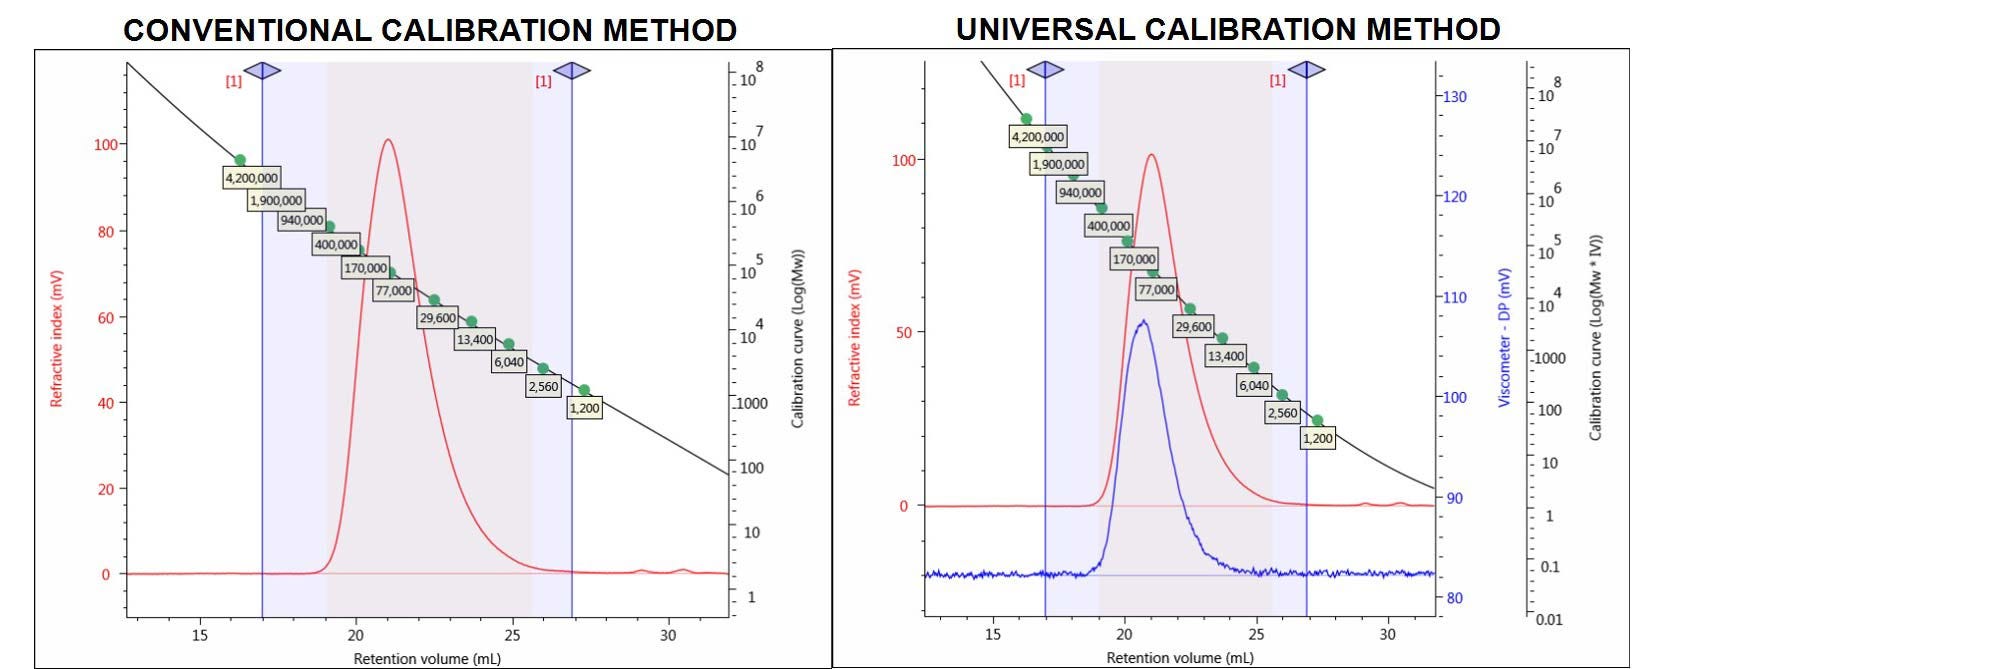
Figure 4. Chromatograms of the PMMA sample showing the RI (red) and viscometer (DP) (blue) detector signals. Left: conventional calibration curve. Right: universal calibration curve.
The quantitative results for PMMA processed with CC and UC methods are shown in Table 1 and compared to the expected results, derived from the multi-detection method using light scattering and including the viscometer detector.
Parameters | PMMA | ||
|---|---|---|---|
CC | UC | MD | |
| Retention volume (mL) | 21.04 | 21.04 | 21.04 |
| Mw (g/mol) | 83,700 | 98,300 | 92,800 |
| Mn (g/mol) | 39,700 | 43,400 | 45,800 |
| Đ | 2.11 | 2.27 | 2.03 |
| IV (dL/g) | N/A | 0.35 | 0.35 |
| Rh (nm) | N/A | 7.82 | 7.68 |
Table 1 shows the main calculated polymers properties available from the OMNISECTM software. The properties showed for PMMA are the weight (Mw) and number (Mn) average molecular weights, dispersity (Đ), intrinsic viscosity (IV), and hydrodynamic radius (Rh). As shown in the table, the conventional calibration (CC) method cannot provide IV and Rh values. These additional properties can in fact be derived thanks to the presence of the viscometer detector in the instrument setup for UC and MD methods. The molecular weight values obtained from CC and UC compared differently to the MD results. In CC method PMMA, which has a different chemistry and different elution profile compared to PS, results to have a relative molecular weight value quite different from the absolute molecular weight values of the MD method. The parameters obtained from UC change in comparison to CC results and are closer to the expected values of the MD method.
Additional CC and UC methods results for different samples are compared in Table 2.
Similar observations can be done for this set of data for polyisoprene (PI), polybutadiene (PBd) and polyvinylchloride (PVC). The different chemistry of the samples compared to the PS standards leads to different results from the CC method compared to UC and MD, while the last two are in a much greater agreement, as expected from the UC method principles.
| Parameters | PI | PBd | PVC | ||||||
|---|---|---|---|---|---|---|---|---|---|
| CC | UC | MD | CC | UC | MD | CC | UC | MD | |
| Retention volume (mL) | 26.32 | 26.32 | 26.32 | 25.78 | 25.78 | 25.78 | 20.85 | 20.85 | 20.85 |
| Mw (g/mol) | 2,200 | 1,700 | 1,700 | 3,200 | 2,000 | 1,900 | 112,700 | 77,700 | 75,600 |
| Mn (g/mol) | 2,000 | 1,600 | 1,600 | 3,000 | 1,900 | 1,800 | 52,900 | 36,800 | 38,000 |
| Đ | 1.09 | 1.06 | 1.08 | 1.06 | 1.05 | 1.06 | 2.13 | 2.11 | 1.99 |
| IV (dL/g) | N/A | 0.06 | 0.06 | N/A | 0.09 | 0.09 | N/A | 0.73 | 0.73 |
| Rh (nm) | N/A | 1.19 | 1.17 | N/A | 1.42 | 1.40 | N/A | 9.21 | 9.08 |
Another way to look at the results derivable from the different methods is to look at the distribution plots on OMNISECTM software. The CC method allows for the samples molecular weight distribution plots to be observed and compared, as shown in Figure 5.
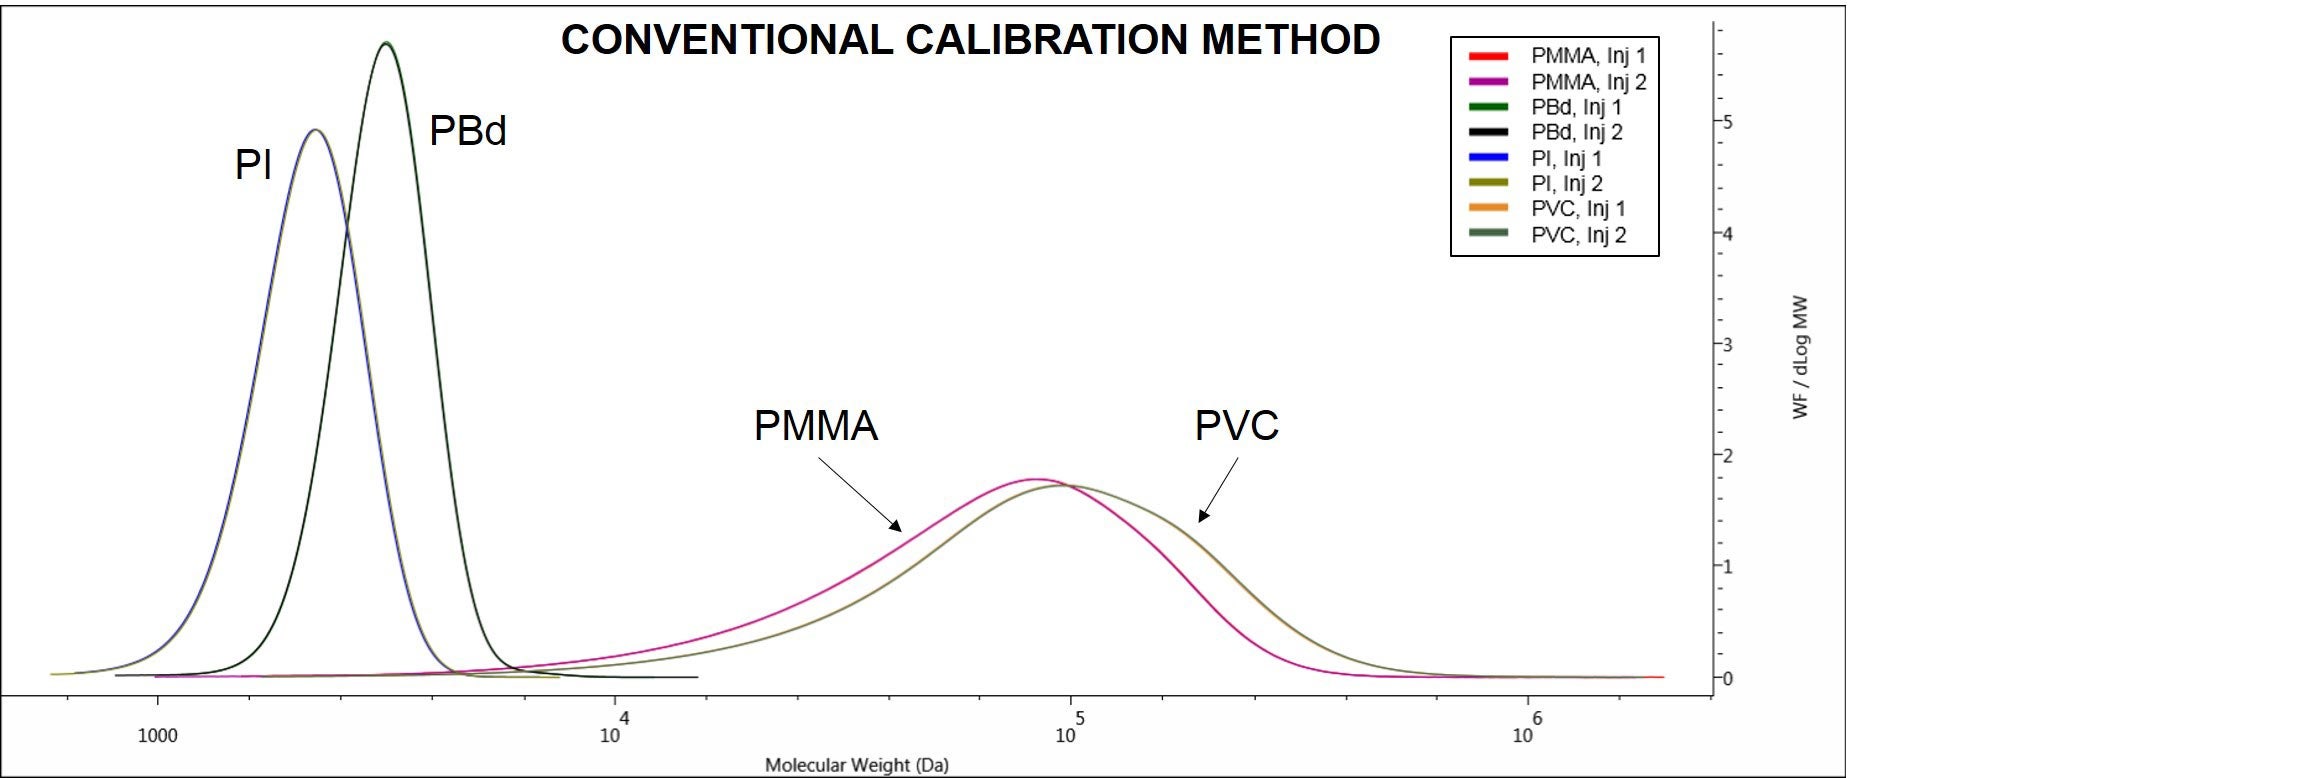
Figure 5. Overlaid duplicate molecular weight distributions of the samples PI, PBd, PMMA and PVC. Data derived using conventional calibration method.
Figure 5 shows the different molecular weight distributions and excellent repeatability for duplicate injections of the samples PI, PBd, PMMA and PVC.
The UC method applied to the same samples can deliver the distribution plots in Figure 6.
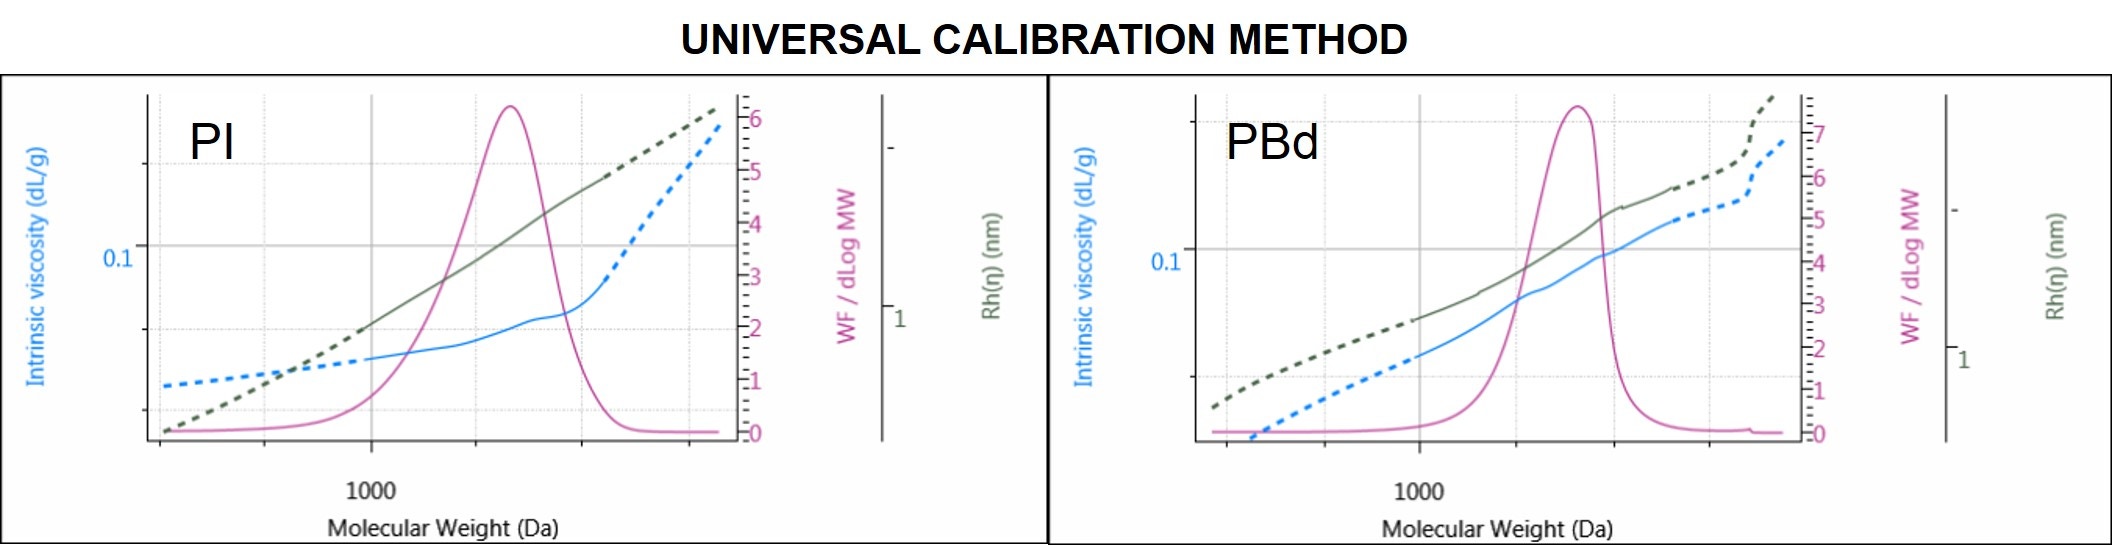
Figure 6. Molecular weight distribution of PI (left) and PBd (right) overlaid with IV and Rh distribution plots.
PI and PBd distribution plots are 2 examples out of the four samples analyzed by UC. In Figure 6 in addition to the molecular weight distributions, the Rh and the IV distributions of the samples offer a better look at the size and structure of the polymers across the whole molecular weight distribution.
Furthermore, when using UC method the structural differences between samples and within a sample itself, can be revealed by means of the Mark-Houwink plot. The M-H plot is a plot of the IV as a function of molecular weight and an example is shown in Figure 7, where PVC and PMMA M-H plots are compared.
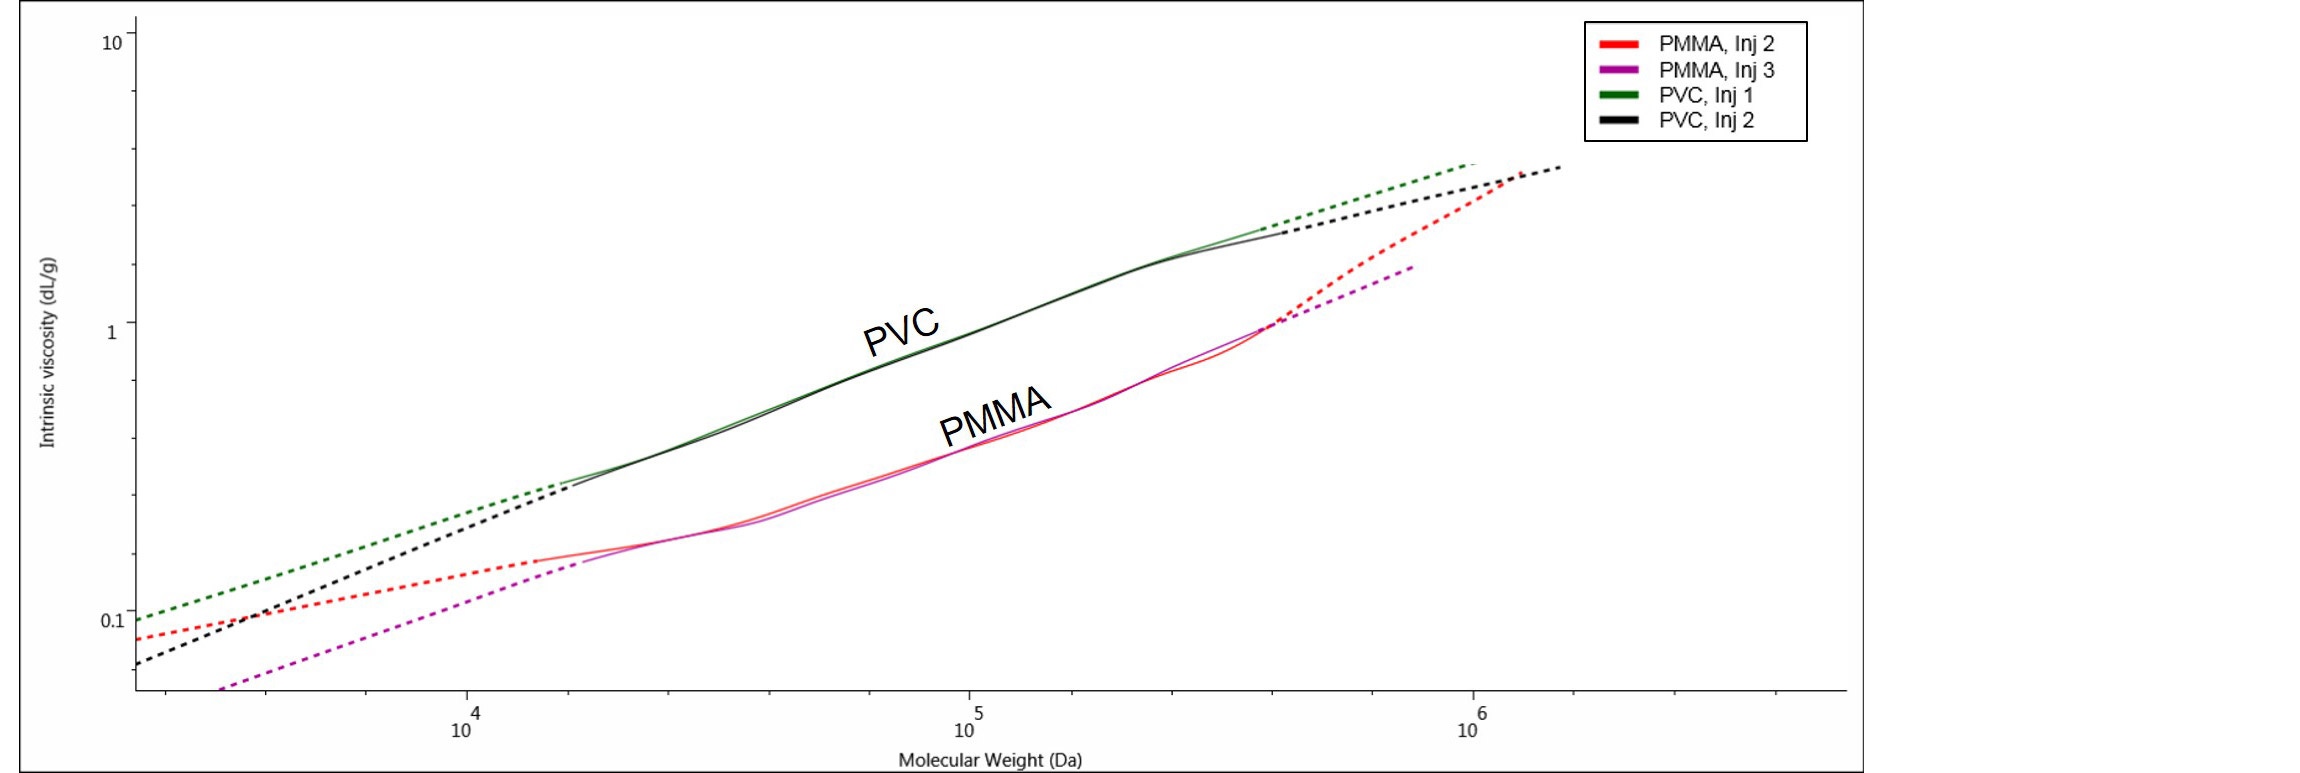
Figure 7. The Mark-Houwink plots for the samples PMMA and PVC, analyzed by UC method.
Here we can clearly see two distinct IV plots for PMMA and PVC, with PMMA showing lower IV values than PVC at comparable molecular weights. In this case, the two polymers have different chemical compositions and the M-H plot is showing that PMMA, with the lowest IV, is a denser polymer than PVC in THF. The M-H plot used with other types of samples can give structural information such as branching and conformation. M-H parameters k and a (M-H a, M-H log K) can be obtained directly from the OMNISECTM software.
This application note has described the successful measurement of samples using column calibration methods in the OMNISECTM software. The use of the OMNISEC system and software for the analysis of samples using column calibration proves to be a valuable addition to the advanced detection features of the OMNISEC system. The OMNISECTM software can easily perform the different types of column calibration and provide the molecular weight characterization of different samples.
Generally, column calibration methods provide good alternatives to the multi-detection method, however, the principle of “more detectors equal more information” still applies. As was highlighted in this application note, in going from applying CC to UC method during sample analysis, the addition of the viscometer detector to the system not only resulted in more accurate molecular weight characterization but also more information about the samples, i.e. size and structural information.
When we add light scattering detectors to this system we further improve the quality of data by eliminating the influence of column retention volume on the results, removing the need for the sample and analytes to be in the same molecular weight range.
(1) J.C. Moore ‘Gel permeation chromatography – A new method for molecular weight distribution of high polymers’ J. Polym. Sci., Part A-2, 835, (1964)