
Modern batteries like Li-ion have revolutionized our day to day life from smart mobile devices to pollution free electric cars and intelligent power management solutions. Batteries also hold the potential to being economical alternatives for mass energy storage to compliment renewable energy resources for power grid applications. Despite these successes, gaps in the battery technology remain in terms of safety as well as performance. Many new materials and battery chemistries are in research and development phase to enhance the energy density, discharge capacity and safety of new generation batteries. Electrodes used in Li-ion batteries have a defining influence on their electrochemical performance and are typically manufactured by coating a metal foil substrate with a multicomponent slurry made up of active electrode particles and conductive additives suspended in a binder solution. Primary particle size and crystalline phases of electrode materials play a significant role in the diffusion of Li-ions and impact key battery performance parameters such as ion transfer rate and battery recharge time. Crystalline phase can broadly be characterized in terms of phase composition and crystallite size.
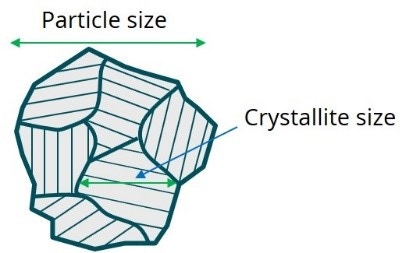
Figure 1. Illustration showing difference between crystallite size and particle size.
Phase composition (e.g. Ni concentration in NCM cathode materials) governs energy density and materials stability during cycling. So, a careful control over phase composition is needed while working on new cathode materials. Having the correct chemical composition of starting materials is not enough, though, to ensure correct phase composition of final cathode materials, as the reactants may not fuse to a single crystalline phase, mandating crystalline phase analysis of finished cathode materials. Another important parameter associated with crystalline phase, the crystallite size, represents coherent crystalline domain, which in general, may be different from the particle size as shown in Figure 1.
However, in processes where primary particles nucleate and later agglomerate to form large secondary particles, a correlation may exist between the crystallite size and the primary particle size.
X-ray diffraction (XRD) is routinely used technique to analyze crystalline phase properties and thus the quality of synthesized powder materials. It can measure phase purity, phase composition, and the crystallite size. Phase analysis using XRD can also be used to derive parameters like degree of graphitization or the orientation index in graphite anode materials.
In this study, five LMFP (LiMnxFe1-x(PO4)) cathode materials with Mn composition varying from 0 to 80%, and some synthetic graphite (anode) samples were investigated using X-ray diffraction for the determination of phase composition and crystallite size in the cathode, and the degree pf graphitization in anode materials. To find the correlation between crystallite size and the primary particle size, few samples were also measured using Ultra-Small Angle X-ray Scattering (USAXS) to determine the primary particle size.
Modern batteries like Lituim-ion have revolutionized our day to day life from smart mobile devices to pollution free electric cars and intelligent power management solutions. Batteries also hold the potential to being economical alternatives for mass energy storage to compliment renewable energy resources for power grid applications. Despite these successes, gaps in the battery technology remain in terms of safety as well as performance. Many new materials and battery chemistries are in research and development phase to enhance the energy density, discharge capacity and safety of new generation batteries. Electrodes used in Li-ion batteries have a defining influence on their electrochemical performance and are typically manufactured by coating a metal foil substrate with a multi-component slurry made up of active electrode particles and conductive additives suspended in a binder solution. Primary particle size and crystalline phases of electrode materials play a significant role in the diffusion of Li-ions and impact key battery performance parameters such as ion transfer rate and battery recharge time. Crystalline phase can broadly be characterized in terms of phase composition and crystallite size.
Phase composition (e.g. Ni concentration in NCM cathode materials) governs energy density and materials stability during charge-discharge cycling. So, a careful control over phase composition is needed while working on new cathode materials. Having the correct chemical composition of starting materials is not enough, though, to ensure correct phase composition of final cathode materials, as the reactants may not fuse to a single crystalline phase, mandating crystalline phase analysis of finished cathode materials. Another important parameter associated with crystalline phase, the crystallite size, represents coherent crystalline domain, which in general, may be different from the particle size as shown in Figure 1.
Figure 1. Illustration showing difference between crystallite size and particle size.
However, in processes where primary particles nucleate and later agglomerate to form large secondary particles, a correlation may exist between the crystallite size and the primary particle size.
X-ray diffraction (XRD) is routinely used technique to analyze crystalline phase properties and thus the quality of synthesized powder materials. It can measure phase purity, phase composition, and the crystallite size. Phase analysis using XRD can also be used to derive parameters like degree of graphitization or the orientation index in graphite anode materials.
In this study, five LMFP (LiMnxFe 1-x 4
XRD measurements
The X-ray diffractograms were collected with the 600W (40kV, 15mA) Malvern Panalytical Aeris compact diffractometer using Co X-ray source. The data were collected in Bragg-Brentano mode with a step size of 0.02° in the 2θ range between 15°-90°. Figure 2 shows the XRD pattern of 20% Mn sample as an example.
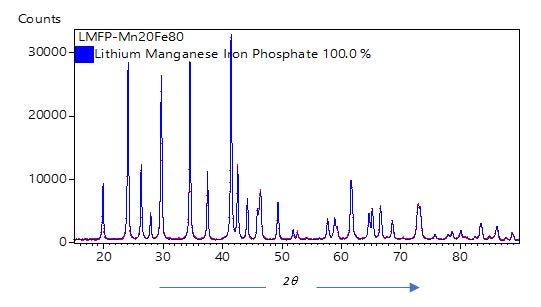
Figure 2. Typical measured room temperature XRD pattern of the 20% Mn sample. The red lines indicate the measured diffraction pattern and blue lines Rietveld modelled pattern.
The high data quality obtained from Aeris compact diffractometer was found suitable for Rietveld refinement to accurately determine unit cell parameters and the crystallite size. Rietveld refinement was performed using HighScore Plus software package. All Bragg peaks of the diffraction pattern were indexed using the Orthorhombic phase with space group Pnma. The starting structure model used to fit the diffraction patterns was created based on the ICDD PDF-4+ reference pattern 04-014-3740. The lattice parameters (a = 10.3586(2) Å, b = 6.0272(1) Å, c = 4.7074(1) Å), crystallite size (739(8) Å) and unit cell volume (293.9(1) Å3) were calculated using Rietveld refinement of the starting model.
Figure 3 shows a section of X-ray diffraction patterns of five LiMnxFe1-x(PO4) sample with x = 0.20, 0.40, 0.60 and 0.80 over 25 - 31° 2θ angular range.
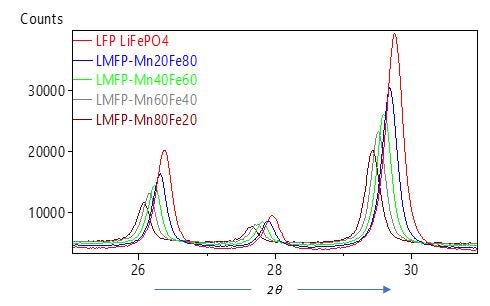
Figure 3. Section of XRD patterns between 25°-31° 2θ range showing peak shift to lower angles (longer d-spacings) as Mn content increases.
Even samples containing high Mn content do not show any extra phase peak, indicating successful incorporation of Mn ion into the LFP (LiFePO4) lattice. However, there is a noticeable shift in the diffraction peaks to lower 2θ values as the Mn content increases. Peak shift to lower 2q values means increase in the unit cell parameter and cell volume. This is also supported by the results obtained from the Rietveld refinement method, wherein both lattice parameters and the unit cell volume were found to increase with increasing Mn content. As shown in Fig. 4, the values of the a-parameter vary linearly from 10.33 Å to 10.43 Å as the Mn concentration increases from 0% to 80% respectively.
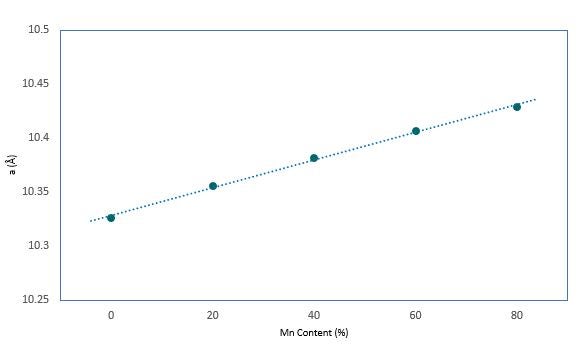
Figure 4. Increase in a-parameter with Mn content as derived from Rietveld refinement of XRD patterns.
This linear correlation can be utilized to predict the Mn concentration for an unknown LMFP cathode material by measuring its unit cell parameter using XRD. Alternately it can also be derived directly from the refinement of occupancy factor, for which the requirement on data quality is much higher.
Rietveld refinement also provided the crystallite sizes in these samples. Figure 5 shows that the crystallite size increases almost linearly from 52 nm to 78 nm as the Mn concentration increases from 0 - 80%.
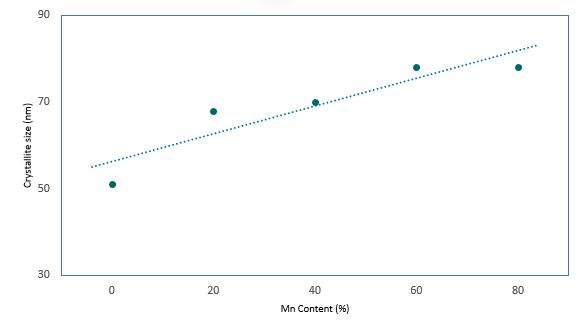
Figure 5. crystallite size growth with increasing Mn content as derived from Rietveld refinement of XRD patterns.
Depending on the growth conditions, crystallite size may be equal to or smaller than the primary particle size, which cannot be determined only from the XRD measurements. Also, the physical measurement of particle size by techniques like laser diffraction or imaging would likely give the secondary agglomerate size and not the primary particle size. A good technique to measure primary particle size is Ultra-Small Angle X-ray Scattering (USAXS). To investigate correlation between crystallite size and primary particle size, some samples were also measured using USAXS module on Empyrean XRD platform.
USAXS Measurements
The room temperature USAXS measurements were performed on the Nano Edition of Empyrean diffractometer (operated at 1800 W: 45 kV, 40 mA) configured with high-resolution optics consisting of crystal monochromators on both the incident and the diffracted beam sides. Setup was capable of measuring over the Ultra SAXS range with scattering data starting from 0.01 Deg onwards. The X-ray scattering data were collected in scan range between -0.01° to 0.4° with a step size of 0.0005°, and total measurement time of 14 minutes. The collected X-ray scattering data were analyzed using EasySAXS software from Malvern Panalytical.
Particle size volume distribution (Dv(r)) with particle radius (R) for an undoped LFP sample is displayed in Figure 6. The median particle diameter calculated using Log-normal approximation is 56 nm in this sample, which correlates very well with the crystallite size (56 nm) obtained from XRD measurement.
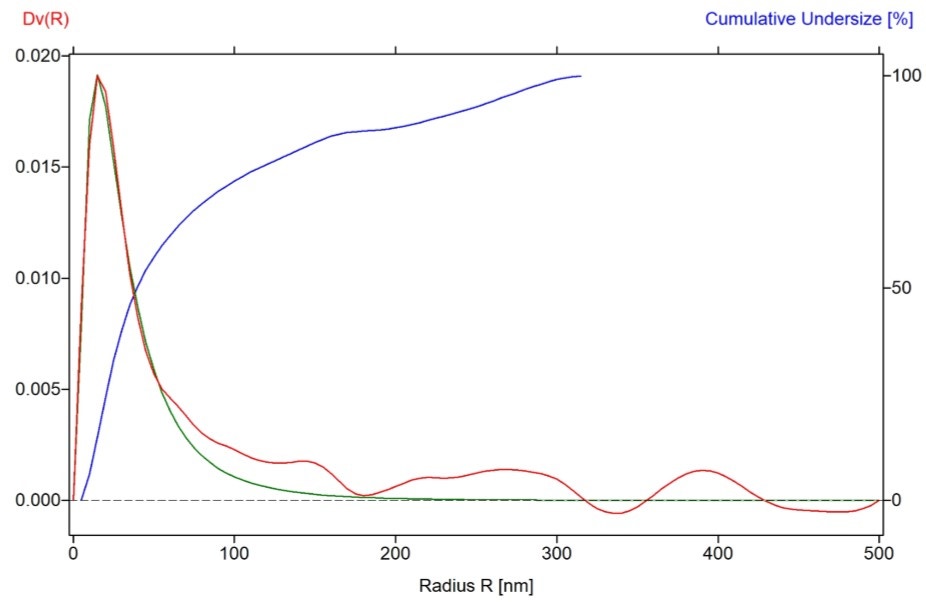
Figure 6. Particle size volume distribution derived from USAXS data on LFP (0% Mn) sample.
The red line indicates the Dv(R) volume-weighted size distribution curve, blue line is Cumulative under size distribution curve (%) and green line represents Log-normal approximation curve.
It should be noted that the particle size measured using USAXS is the primary particle size. The secondary particle size was also measured using laser diffraction on Mastersizer 3000, which was found to be 2.97µm. Particle size using USAXS was measured on one more sample and was also found to have a good correlation with the corresponding crystallite size.
Degree of Graphitization in synthetic graphite: the degree of graphitization (g) can be measured form the shift in the sample peak position of 002 lattice planes from relative to the ideal graphite peak position using equation (1):
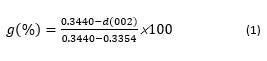
where g (%) is the degree of graphitization, 0.3440 nm is the interlayer spacing of the fully non-graphitized carbon, 0.3354 nm is the interlayer spacing of the ideal graphite crystals, and the d (002) is th einterlayer spacing of the 002 peak of the sample.
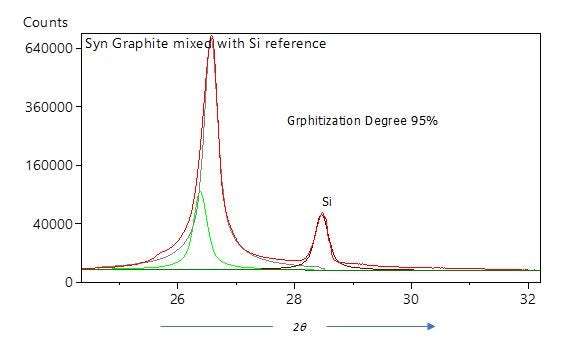
Figure 7. Degree of graphitization derived from the d (002) peak shift in the XRD pattern. Red is the measured diffractogram, while green, grey and brown curves are the fitted peaks.
Sometimes material may have 2 phases with different degree of graphitization. In such cases peak area weighted average may be used to calculate the average degree of graphitization. As the calculation accuracy depends on the accuracy of peak position measurement, it is advisable to add some reference sample with known XRD peak position not overlapping with graphite peak. Figure 7 shows the degree of graphitization obtained from XRD measurement in one such synthetic graphite sample where Si powder was added as reference.
The Aeris XRD instrument can be used to analyze crystalline phase of battery electrode materials to measure important parameters like crystalline phase composition, crystallite size and degree of graphitization. USAXS analysis on Empyrean XRD platform can provide information about primary particle size in addition, which might be important to understand ion diffusion in the electrode materials. In the investigated LMFP samples, a good correlation was found between the primary particle size and the crystallite size.