The existing norms and standards for respirable crystalline silica quantification do not prescribe a specific instrument configuration, but they do mention the instrument settings used for the method validation. These norms and standards [3-6] utilized floor-standing full-power XRD instruments and did not mention compact low-power XRD instruments. In part, this is because at the time the norms were established there was a performance gap between full-power floor-standing and low-power compact XRD units. However, with the constant advances in the X-ray source, goniometer design and detection technologies, the performance gap between floor-standing and compact XRD instruments has greatly reduced.
In this case study, we demonstrate that Malvern Panalytical’s compact XRD, Aeris is capable of delivering the sensitivity required to comply with ISO regulations. We also demonstrate timeliness, and repeatability of results as well as the advantages of reduced cost and reduced infrastructure requirements. Hence making Aeris a preferred choice for respirable crystalline silica analysis.

Figure 1 Blasting, cutting, grinding and drilling of silica–containing materials can produce hazardous airborne silica dust.
The occupational exposure limits to RCS vary from country to country. Nowadays it is generally around the 0.1 mg/m3 mark for an 8-hour shift. However, the limits are under constant review, with lower maxima proposed worldwide. In 2017 the permissible exposure limit for RCS in the USA was reduced to 0.05 mg/m3 as an 8-hour time-weighted average [1]. In 2018 a spike in occupational silicosis cases in Australia triggered the review of the workplace exposure standard for RCS, resulting in the lowering of the limit to 0.05 mg/m3 in 2020 [2].
Historically several analytical methods were used for the quantification of RCS on a filter, including atomic absorption, colorimetry, gravimetry, microscopy, infrared spectroscopy (IR) and X-ray diffraction (XRD). The general approach, common for the listed methods, is to correlate an instrument response to a silica load on a filter by means of a calibration line built using a set of reference samples. Of the analytical methods mentioned above, only XRD and IR are still routinely utilized for RCS analyses worldwide because they are the only methods that have sufficient sensitivity to comply with the ever-decreasing exposure limits [3-6]. XRD in particular has become the preferred method for RCS analysis because it is better than IR for dealing with phase interference in complex mineralogical matrices, which enables the accurate quantification of silica polymorphs to the lower limits of detection and quantification in a wide variety of industrial dusts [3].
The existing norms and standards for RCS quantification do not prescribe a specific instrument configuration, but they do mention the instrument settings used for the method validation. These norms and standards [3-6] utilized floor-standing full-power XRD instruments and did not mention compact low-power XRD instruments. In part, this is because at the time the norms were established there was a performance gap between full-power floor-standing and low-power compact XRD units. However, with the constant advances in the X-ray source, goniometer design and detection technologies, the performance gap between floor standing and compact XRD instruments has greatly reduced. In particular, the availability of a 600 W X-ray source on compact XRD instruments over the earlier models with 300 W has made them compete more favorably with 1.8 kW floor-standing units. Moreover, the advantages of reduced cost and reduced infrastructure requirements make low-power compact XRD instruments a preferred choice for this application.
In this case study, we compare the performance of Malvern Panalytical Aeris compact 600 W diffractometer to Empyrean floor-standing 1.8 kW diffractometer equipped with advanced optical beam path. We show that both instruments deliver the sensitivity required for compliance with existing RCS regulations, albeit in different measurement times. Furthermore, we discuss the influence of the sample preparation method and sample analysis time on the limits of detection and quantification, and we give an example of the working respirable α-quartz quantification method following the ISO 16258-1 standard using Aeris 600 W diffractometer.
Single replicas of 22 μg respirable α-quartz on PVC (polyvinyl chloride) filter and of 4.8 μg respirable quartz redeposited on a silver filter (the courtesy of RJ Lee Group, Monroeville, PA, USA) were used for the quantitative comparison of the instrument setups, detailed below. The samples were prepared following the procedures described in MDHS 101/2 method [4], ISO 24095-2009 standard [5] using the NIST respirable α-quartz SRM 1878b, and NIOSH 7500(4) method [6] using the NIST respirable α-quartz SRM 2950 series, respectively.
Comparative powder XRD measurements were performed on Malvern Panalytical Empyrean diffractometer operated at 1.8 kW, and compact Aeris diffractometer operated at 600 W. Both diffractometers were equipped with Cu LFF tube (λ = 1.5418 Å), spinner stage with a beam knife and the PIXcel1D hybrid pixel detector. The Aeris’ goniometer has a 145 mm radius compared to the 240 mm radius of the Empyrean’s goniometer. The shorter radius compensates for the lower power. In addition to higher power, a major difference of the Empyrean diffractometer is that it has room to accommodate advanced incident-beam optical modules such as the iCore or Bragg-BrentanoHD, as compared to the traditional divergence slit on the Aeris. Superior energy resolution (~450 eV) of iCore or Bragg-BrentanoHD allows to filter out kBeta and white radiation, thus lowering the overall background and improving the detection limits. Empyrean setup with iCore optics was used in this case study. Another advantage of Empyrean is the larger sample changer with 48 sample positions to facilitate higher sample throughput, compared to 6 positions autosampler on Aeris.
XRD measurements were performed in the 26.0 – 27.5º 2θ range with a step size of 0.02º 2θ to capture quartz primary (101) diffraction peak. For better particle statistics the sample was spun during the measurement using a spinner sample stage.
Determining the limits of detection (LoD) and limits of quantification (LoQ) is not a trivial task. Several factors, including instrument performance, quality of reference samples, sample preparation procedure, etc., contribute to the resulting LoD and LoQ. To facilitate easy instrument performance comparison between various instrument setups we adopted the following method for estimation of instrument LoD and LoQ using a single filter sample. In this approach, a filter sample with known analyte load was placed in a suitable sample holder and XRD scans were recorded using different instruments or instrument setups. The obtained XRD scans were analyzed using HighScore software suite [7] to estimate LoD and LoQ using the following equations:
LoD = 3 × √Ibkg
LoQ = 10 × √Ibkg (1)
where Ibkg is the average background intensity at the peak position.
The LoD and LoQ in counts, calculated using Eq. 1, are converted to microgram values using the known analyte load on a filter and recorded maximum net peak intensity following the simple ratio calculation:
LoD (µg) = LoD (counts) x analyte load / max net peak intensity (2)
The above approach does not account for factors like sample preparation, variability of blanks, crystallite size, particle statistics and counting statistics, and provides a quantitative comparison of instrument performance only. The complete method evaluation should account for several other factors following the suitable norms, e.g. ISO 11843. ISO 11843 was used for the α-quartz calibration presented in Figure 4.
Two filter samples with known α-quartz load were measured on both, Empyrean and Aeris, for the quantitative comparison between the two instrument setups. The comparison of short range XRD patterns measured around the primary quartz peak is shown in Figure 2. The instrument LoD/LoQ were calculated for each presented scan using Eq. 1-2, the results are summarised in Table 1.
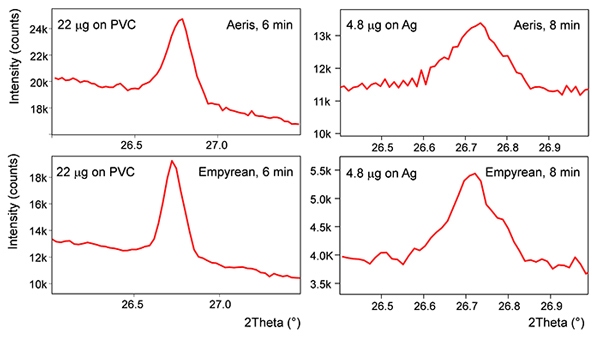
Figure 2. Short-range XRD patterns measured around primary α-quartz diffraction peak using Aeris (top) and Empyrean with Bragg-BrentanoHD filter (bottom). Sample with 4.8 μg α-quartz load on Ag filter is courtesy of RJ Lee Group, Monroeville, PA, USA.
| 22 µg on PVC filter | 4.8 µg on Ag filter | |||||||||
|---|---|---|---|---|---|---|---|---|---|---|
| Max Int cts | LoD* cts | LoD* µg | LoQ* cts | LoQ* µg | Max Int cts | LoD* cts | LoD* µg | LoQ* cts | LoQ* µg | |
| Aeris | 6042 | 412 | 1.5 | 1356 | 4.8 | 963 | 321 | 0.8 | 1057 | 2.6 |
| Empyrean | 7194 | 327 | 1.0 | 1078 | 3.2 | 744 | 186 | 0.6 | 621 | 1.9 |
Table 1. Instrument LoD and LoQ calculated using Eq. 1-2 for the scans given in Figure 2.
* Given LoD/LoQ are calculated using Equations 1,2. These values are indicative of the instrument performance only. See “Estimation of limits of detection and quantification” section for the additional explanation.
Despite its compact size, simplified optical path and low operating power the Aeris 600 W (the top plots in Figure 2) provides sufficient sensitivity for detection and quantification of very low α-quartz loads within the reasonable measurement time of under 10 minutes. The Empyrean is a larger instrument, allowing the usage of more advanced optical modules, e.g. iCore or Bragg-BrentanoHD, to achieve even lower LoD/LoQ (Empyrean data in the lower plots in Figure 2). Furthermore, Empyrean enables higher sample throughput due to the larger sample changer.
The presented results also show that instrument LoD/LoQ for the redeposition on silver (Ag) filter method is generally better than that of direct on (PVC) filter method. This is due to the lower contribution of filter material to the overall scan intensities.
Instrument LoD and LoQ can be further improved by increasing the measurement time to produce better signal-to-noise ratio (inset in Figure 3). In Figure 3, instrument LoD and LoQ, as estimated using Eq. 1-2, are plotted as a function of measurement time for Aeris 600 W XRD system. Data were provided by Tom Edwards from NATA accredited MPL Laboratories, Perth, Australia. As seen in Figure 3, the most significant improvement of the estimated LoD and LoQ is achieved within the first 10 minutes. Further increasing the measurement time brings only a marginal improvement, which flattens out by 25-30 minutes mark. Generally, a 5 - 10-minute measurement around the primary quartz reflection is sufficient to achieve satisfactory instrument LoD/LoQ to comply with the existing regulations on an Aeris 600 W system.
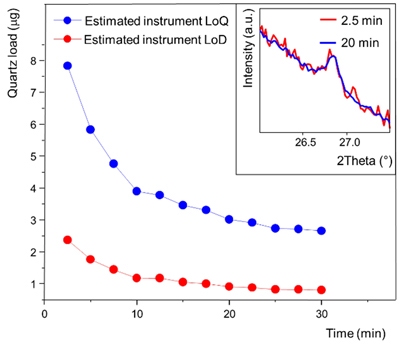
Figure 3. Aeris LoD (red) and LoQ (blue) as a function of measurement time, estimated using Eq. 1-2. The insert shows the 2.5 (red) and 20-min (blue) scans from the PVC filter with 4.7 μg α-quartz load, measured using Aeris 600 W diffractometer. The sample and data are courtesy of Tom Edwards, NATA accredited MPL Laboratories, Perth, Australia.
Figure 4 gives an example of a working calibration line, developed by Carl Strautins (Safe Environments NATA accredited testing laboratory, Sydney, Australia) for quantification of respirable α-quartz on PVC filter using an Aeris 600 W diffractometer. The measurement time per sample was optimized to 5 minutes to achieve 5 μg method LoD, estimated using ISO 11843 definition. The response curve has high linearity and can be used for accurate quantification of respirable silica in unknown samples.
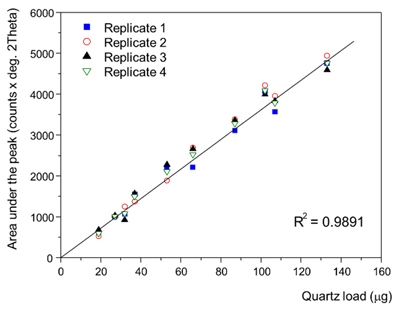
Figure 4. XRD calibration line for direct on filter quantification of respirable quartz, compliant with ISO 16258-1 standard. The calibration line is developed by Carl Strautins (Safe Environments NATA accredited testing laboratory, Sydney, Australia) using an Aeris 600 W tabletop diffractometer.
Stringent regulations of occupational exposure to respirable silica pose a significant challenge to analytical methods and instrumentation. This note gives an overview of the capabilities of Malvern Panalytical diffractometers to meet this challenge. Both the 600 W Aeris compact diffractometer and the full-power Empyrean diffractometers can deliver sensitivity in compliance with the existing norms and regulations in less than 10 minutes. Aeris can be equipped with 6 position autosampler for unattended measurement on up to 6 samples in one batch. Empyrean on the other hand can be configured with up to 48 position autosampler for higher throughput requirements. The compact Aeris diffractometer offers a cost-effective solution for routine filter screening; whilst the multi-purpose Empyrean diffractometer opens additional possibilities: filter screening with improved sensitivity, higher sample throughput, a wide variety of other X-ray scattering applications for R&D purposes.
[1] OSHA’s Respirable Crystalline Silica Standard for Construction. OSHAFactSheet, 2017, https://www.osha.gov/Publications/OSHA3681.pdf
[2] Workplace exposure standards for airborne contaminants, online article on Safe Work Australia website, https://www.safeworkaustralia.gov.au/doc/workplace-exposure-standards-airborne-contaminants
[3] Crystalline Silica Quartz and Cristobalite, ID-142, OSHA, 2015
[4] Crystalline silica in respirable airborne dusts MDHS 101/2, HSE, 2014, https://www.hse.gov.uk/pubns/mdhs/pdfs/mdhs101.pdf
[5] Workplace air – Guidance for the measurement of respirable crystalline silica, ISO 24095:2009, https://www.iso.org/standard/42006.html
[6] NIOSH Manual of Analytical Methods, Silica, Crystalline, by XRD: Method 7500 (4), 2003
[7] Degen, T., Sadki, M., Bron, E., König, U., Nénert, G., The HighScore suite. Powder Diffraction 29, S13-S1, 2014