
Calibrating a Viscotek multi-detector system generates the instrument constants and performs any required offset and band-broadening calculations. For systems making measurements of synthetic polymers such as polystyrene or natural polymers such as polysaccharides, the calibration process is essentially identical. For these systems, calibration is performed using a sample of known molecular weight and with a narrow polydispersity. The calibration is then checked against a second sample with a wider polydispersity before moving on to sample analysis.
Carefully creating a method takes just a few minutes and following this protocol will ensure that calculated results are as accurate and reliable as possible. Once the method is created, it takes just seconds to analyze the subsequent samples.
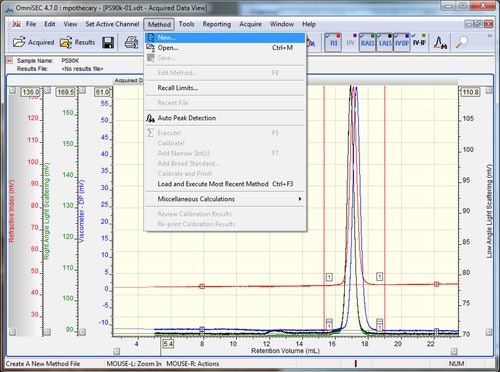
Open the data file to be used as the calibration standard in OmniSEC. If the system is running in organic solvents, this is usually a polystyrene or polymethyl methacrylate. The molecular mass has to match analytical conditions (i.e. column separation range). Furthermore, the molecules have to be isotropic scatterers so their hydrodynamic radius should be ≤ 10 nm. Typically a molecular mass of 90 kDa to 100 kDa will be good. If the system is running aqueous buffers this is usually a PEO or a Pullulan. The concentration of the standard sample should have been known and input when the sample was run. The accuracy of this initial concentration is crucial to calculating accurate molecular weights at later stages. Check that all detectors show good signal quality, and then add all of the detectors to the display by selecting the detector buttons (if using an OmniSEC version < 4.7, hold Ctrl while selecting the detectors). Set the baseline and integration limits around the entire sample using the right-click menu, and then select the 'Method - New' option from the main menu (figure 1).
|
Setting baselines and limits can be done by right-clicking on the 'Acquired Data View' and selecting the appropriate options. A quicker way to set limits and baselines is with the shortcut keys. Holding down the 'shift' key and left clicking in the Acquired Data View' will drop a limit at the elution volume corresponding to the current mouse pointer x-position on all of the detector chromatograms. A second left-click at a different location will drop the second limit. Holding down the 'shift' key and right clicking will place baselines on all of the detector chromatograms. If the 'control' key is held down, instead of 'shift', then the limits or baselines will only be placed on the active channel. To remove limits and baselines, select the appropriate option from the right-click menu.
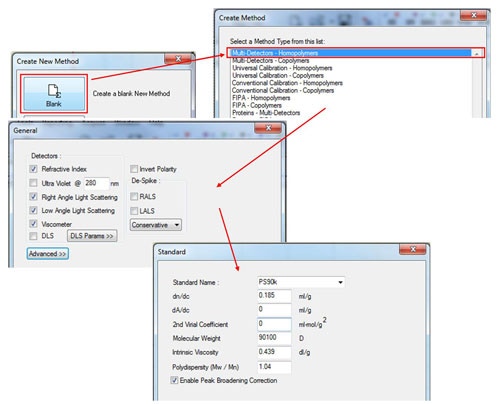
In the Create New Method window, select the 'Blank' option, and then select in the 'Multi-Detectors-Homopolymers' option. The next screen will show the detectors to be calibrated. Select the detectors as appropriate for the system (the concentration detectors is usually the refractive index (RI)) and then click 'Next'. Enter the known parameters for the standard in the 'Standard' window. These should be provided with the standard and those for a PS90k are shown in figure 2. Note that the 2nd virial coefficient is not required, however, if the value is known, it can be entered in the appropriate box. If polydispersity is not written on the standard, it can be calculated as Pd = Mw/Mn. If the UV detector is used, the dA/dc value is equivalent to the extinction coefficient presented as Aλ = X ml mg-1 cm-1 (The value at 1% w/v can be used as long as this is consistent with the sample tab.
|
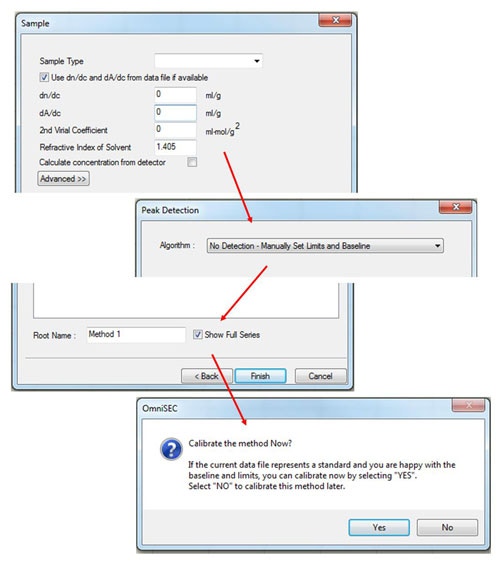
After entering the standard properties, click 'Next', and then fill in the appropriate values in the 'Sample' window (figure 3). If the measured sample is different from the standard, only the refractive index of the solvent needs to be input. (If the dn/dc of the sample is known, it can also be input, in which case, the 'calculate concentration from detector' box must be checked.)
To complete the initial calibration keep the 'peak detection' algorithm set to Manual and then save the calibration with an appropriate name. After saving, the software will ask 'Calibrate the method now?' Click 'Yes' and the calibration results will be displayed.
(If limits have not already been set, a different message will appear - click 'OK', set limits and baselines as described earlier and then select 'Calibrate!' from the 'Method' menu.)
|
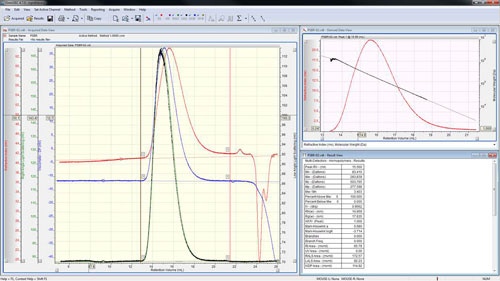
The peaks are aligned and the detector calibration constants reported in the 'Result View' (figure 4).

|
The calibration is now effectively complete; however good practice says that it is worth checking the calibration against a different sample whose molecular weight is also known. Correctly measuring the molecular weight of a second sample will give a high level of confidence that the calibration has been successful and the subsequent measurements of unknown samples will give accurate answers.
Open the second standard file or go to it using the 'Close & Next' option in the file menu (or press F12). For organic solvents, this is typically a second polystyrene such as PS280k or a polymethyl methacrylate. For aqueous systems, this is often a dextran such as D70k. Place limits and baselines around the peak as described earlier and then execute using the 'Execute!' button (∑) or by pressing F5. The calculated molecular weight should be close to the value stated on the sample. Under suitable chromatographic conditions, the molecular weight trace decreases steadily and monotonously along the chromatogram showing an excellent distribution of the sample as in figure 5. A lack of steadiness in the molecular mass vs. retention volume plot usually indicates an error during calibration such as incorrectly set baselines. A non-monotonous (where the molecular weight increases with retention volume at some point) plot usually indicates unsuitable chromatographic conditions.
|
The calibration is now complete and the method can be used to analyze other samples in exactly the same way as the second standard. It is best practice to run a standard and calibrate at the beginning of each set of measurements. If calibration every time is not required, then at the very least, a reference standard should be run and analyzed with the existing method to ensure it is working properly.
Note: This calibration process is exactly the same for synthetic polymer samples in organic solvents and for natural polymer samples in aqueous buffers. Only the values used in the standard and sample tabs change depending on the specific standards used.
It is important to understand "what" is being calibrated during this process. The calibration procedures within the Viscotek OmniSEC software perform two functions.
There are a variety of GPC detector calibration standards available, either from Malvern or 3rd party vendors. When selecting an appropriate calibration standard, there are three things to consider.