
Whilst dynamic light scattering (DLS) is a ubiquitous tool for the characterization of nanomaterials, there may be cases where we want to also know about larger material that might also be present within the sample. Here we will introduce a new analysis model to help characterize particles at sizes not typically measurable via DLS with some examples of the benefits and limitations of this new feature.
The range of particle sizes that can be accurately characterized by DLS is defined by the assumptions that are applied in particle size calculation. For an accurate particle size to be determined, light must be singly scattered by the sample, the average scattering intensity should be constant, and the only motion of the particles must be via Brownian motion.
Literature sources describing DLS may quote the measurable range of the technique to be up to around 1 µm. This is because at larger particle sizes our ability to fulfill all the factors listed above may be compromised. Large particles are more susceptible to non-Brownian motion such as sedimentation or convection and will scatter more photons and are therefore more likely to scatter the incident light multiple times.
With optimal sample concentrations, and measures to reduce the impact of non-Brownian motion, accurate DLS measurements of particle size up to 10 µm are possible. A convenient method to measure these large sizes is using the unique Low Volume Disposable Sizing Cell (LVDSC, part number ZSU1002)[1], as the small cross section reduces multiple scattering [2] and convection flow so allow these larger particles to be measured without density matching the dispersant [3,4].
Dynamic light scattering can report a particle size by two separate approaches. Cumulants is the ISO recommended method and reports a ZAve size and Polydispersity Index. Within this analysis there are no assumptions around particle size and results of more than 10 µm may be reported. A limitation of cumulants is the ensemble approach whereby distributions or the presence of multiple populations are not revealed.
Using an inversion analysis, a particle size distribution can be generated and report multiple size populations, however a limitation here is that only sizes within a specified range can be reported.
Often, we may rely on the combination of these parameters to understand the range of particle sizes in our samples, however the disconnect between how these methods work can sometimes lead to confusion.
Given the increase in confidence in being able to measure large particle sizes using a capillary, a new analysis option for extended particle sizes has been introduced in the ZS Xplorer software for Zetasizer. This uses the same regularisation or “smoothing” and point spacing as the default distribution analysis option (General purpose) but has an extended range of size classes. The weighting used in the analysis has also be adjusted such that the noise that we see in the baseline of the correlation function in these measurements has a lesser impact on the result.
As a demonstration of the new analysis model, a series of NIST tracible polystyrene standard microparticles were prepared in 10mM NaCl.
Figure 1 shows a resolved particle size distribution centered at 10 µm for a 10 µm latex sample. Here it is worth noting that previously only ZAve results may have been reported at this size range. Where 10 µm was reported as the upper range for other systems, this may have been demonstrated only as the tail for a distribution of a smaller material, e.g. a 9 µm latex.
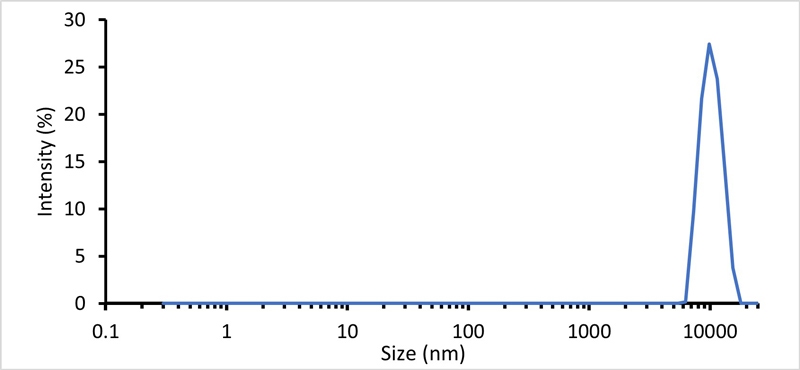
Figure 1: Intensity weighted particle size distribution for a 10 µm polystyrene latex using the General-Purpose Extended distribution analysis model.
The extended range analysis can also be used to characterize mixtures of differently sized material. Figure 2 shows what appears to be a monomodal dispersion with a peak centered at 197 nm but a much larger ZAve of 394 nm. This sample was a 200 nm latex which has been doped with 15 µm latex. This demonstrates a potential confusion arising with such measurements as cumulants analysis suggests the presence of larger material which we cannot see evidence of in the distribution.
| Analysis Model | ZAve (nm) | Polydispersity Index | Peak One Mean by Intensity (nm) | Peak Two Mean by Intensity (nm) |
|---|---|---|---|---|
| General Purpose | 374.4 | 0.594 | 179 | |
| General Purpose Extended Range | 374.4 | 0.594 | 194.6 | 1.15E+04 |
Table 1: Reported particle size metrics for a mixture of 200 nm and 15 µm latex, analyzed using different distribution models. Note that the cumulants derived results, ZAve and Polydispersity Index are unaffected by the change in analysis model as these are calculated independently from the distribution.
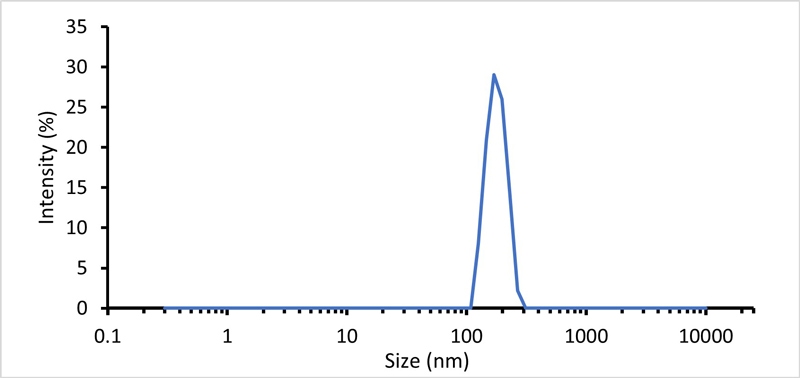
size of 394nm.AveFigure 2: Intensity weighted particle size distribution for a mixture of 200nm and 15 um polystyrene latex using General Purpose distribution analysis. Here the sample appears monomodal with a mean peak size at 197nm but a Z
If the same data is analyzed using the extended range analysis, we can see an additional larger peak present giving us an indication of the presence of our doped material, Table 1, Figure 3.
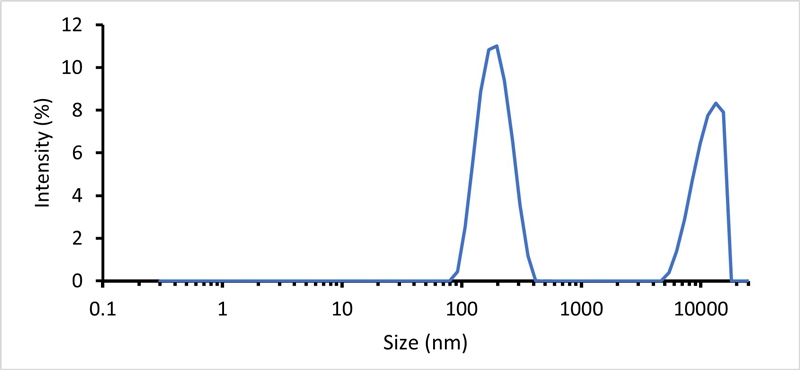
Figure 3: Intensity weighted particle size distribution for a mixture of 200 nm and 15 µm polystyrene latex using General Purpose Extended distribution analysis. Here we now see a more accurate peak size for the 200 nm latex and the presence of a larger size component.
Whilst Figure 1 and 3 show reporting of distribution sizes of 10 µm and beyond, it must however be stressed that the accuracy of such large sized particles becomes compromised as discussed earlier. As particle size increases, the optimum concentration to mitigate noise effects during the measurement becomes increasingly narrow. Figure 4 shows the spread of repeat measurements of a 10 µm latex prepared to different concentrations showing a sweet spot at 8 mg/ml. away from which we would see either a systematic offset in reported size or poor repeatability.
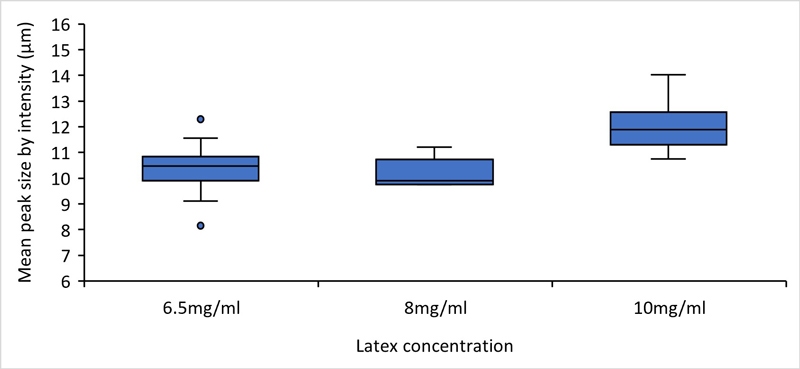
Figure 4: Mean peak size for repeat measurements of 10 µm polystyrene latex prepared at different concentrations. Here we can see an optimal range in which these samples can be measured, away from which the measurements become less accurate.
Beyond around 10 µm in size, the concentrations where we see the effects of multiple scattering and number fluctuations will start to overlap. This extended size range does not replace the accuracy of other orthogonal techniques such as laser diffraction for measuring micro sized material but allows characterization of larger material not previously quantifiable via DLS. For nanomaterials where the presence of large material is of critical interest, such as in pigment quality assurance or aggregation studies, this analysis allows us to see both the large and small material in the same instrument.
This means that even when prepared to a concentration where we produce repeatable measurements, the particle size is likely to be underestimated. Figure 5 shows the particle size distribution for a 15 and 20 µm latex respectively. The ZAve and Peak size for the 15 µm latex were reported as 13.0 and 13.6 µm respectively. The ZAve for the 20 µm latex was variable across all measurements but a peak in the distribution between 12 and 15 µm was consistently reported.
This shows that at extreme particle sizes, the particle size reported is no longer accurate, but may be used for qualitative assessment of the presence of large materials within a sample of much smaller nanoparticles.
The propensity for a material to show multiple scattering depends upon its optical properties, meaning the size at which these factors become an effect on measurement accuracy is sample-dependent.
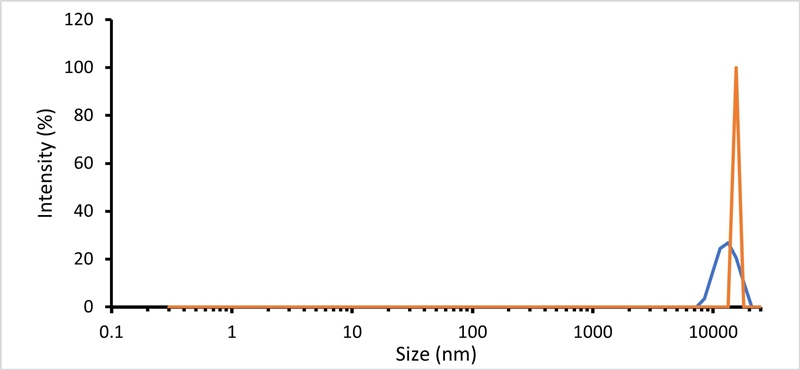
Figure 5: Intensity weighted particle size distribution for a 15 um (blue) and 20 um (orange) polystyrene latex.
Extended size range analysis can also be used in conjunction with other quality metrics within the ZS Xplorer software. Data for particle size measurements is captured using a method called adaptive correlation, where uncharacteristic data gathered from the sample is analyzed separately [5,6]. This can be used to give an indication of the type and amount of spurious material within the sample. The particle size distribution for this “transient” data can however sometimes appear comparable to the “steady state” data.
As a demonstration of this, a 200 nm latex sample was doped with a trace amount of 10 µm latex. Throughout most of this measurement, only the 200 nm latex was detected however some sub runs of the measurement were classified as different. This transient result however looks comparable to the main result when using the traditional size range in the distribution analysis, Figure 6.
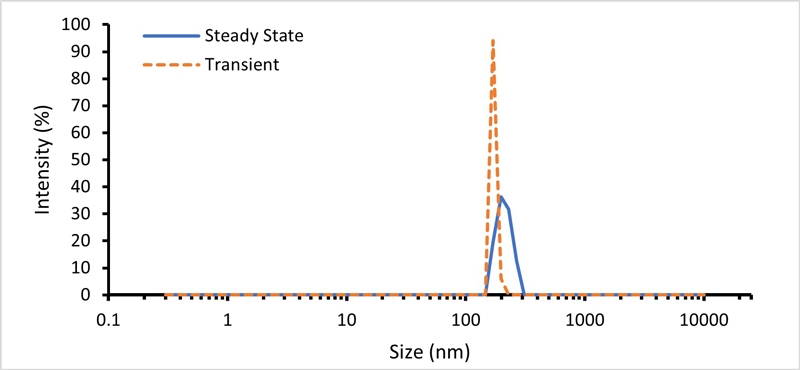
Figure 6: Steady state (blue) and transient data (orange) for a doped sample of 200 nm latex using traditional analysis settings.
When we analyze the same data using extended size range, we can now see a peak present in the transient result, Figure 7. Whilst such large material would be more suited to orthogonal characterization techniques, here we can now allow the presence of this material to be detected qualitatively via DLS at the same time as nanoscale material.
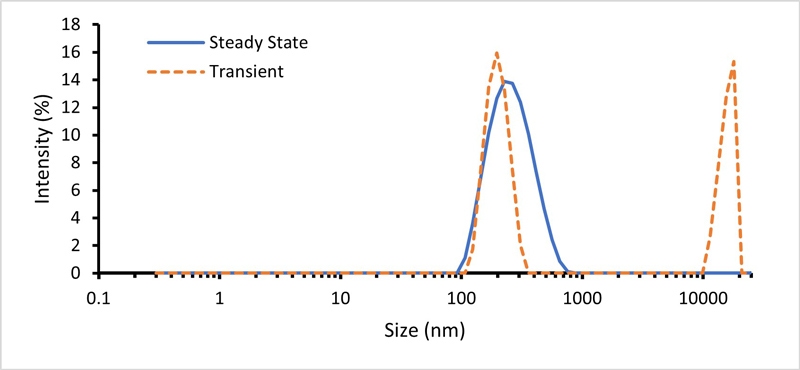
Figure 7: Steady-state (blue) and transient data (orange) for a doped sample of 200 nm latex using extended size range analysis, showing the presence of additional large material outside of the standard reported size range.
As the regularization used in the analysis is the same as the existing General Purpose analysis model, the option for extended size range is listed as “General Purpose Extended Range” in the data processing options when setting up, Figure 8, or editing a measurement result in ZS Xplorer, Figure 9.
As discussed, a range of sample factors can impact the accuracy of measurements of larger sized particles by DLS. As well as optimizing the concentration range, the low volume disposable sizing cell (ZSU1002) mitigates the potential inaccuracies caused by convection flow in a much larger cell. For this reason, extended size range is only available as an option in the ZS Xplorer software for measurements performed using this cell.
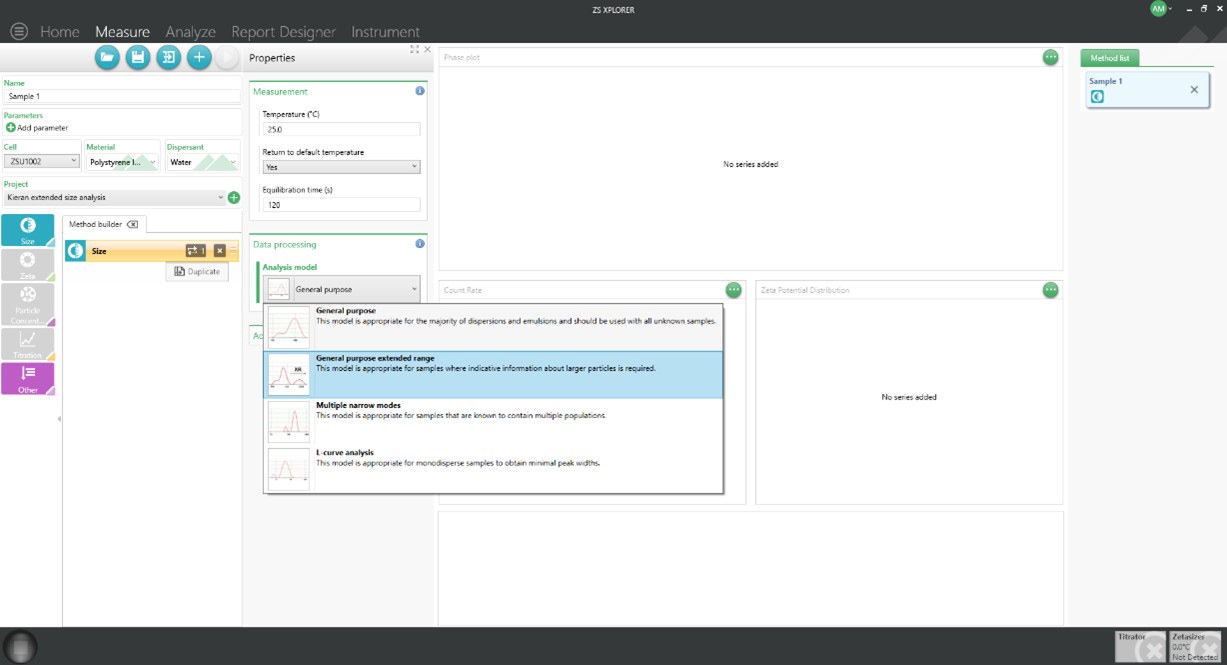
Figure 8: Choosing the analysis model for the particle size distribution analysis when setting up a measurement in ZS Xplorer.
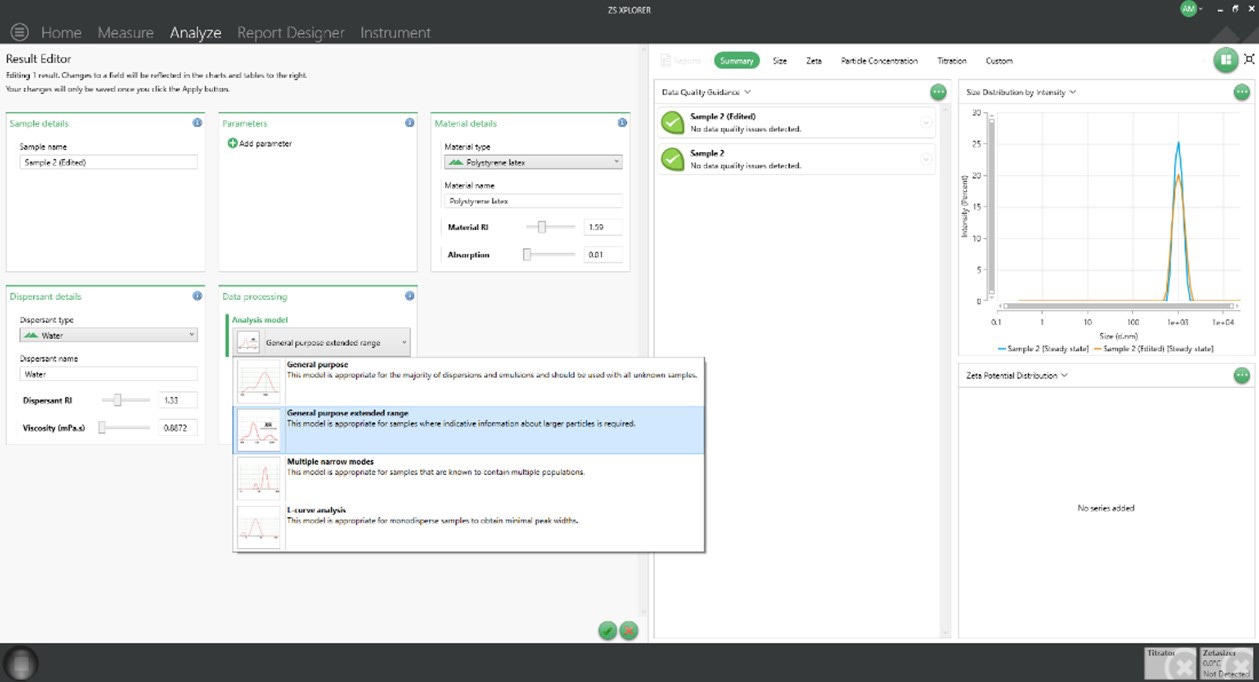
Figure 9: Changing the analysis model for particle size distribution analysis when editing a measurement record in ZS Xplorer. Measurements performed using previous software versions can be edited to use Extended Range analysis if the LVDSC was used for the measurement.
As with other particle size measurements performed using Zetasizer Advance and ZS Xplorer, measurements records are labeled with Data Quality Guidance advice. The guidance given is appropriate regardless of the analysis model used, and guidance around multiple scattering or number fluctuations will still stand with the extended range analysis. As discussed at extreme particle sizes both high and low concentration effects may be observed, and the Data Quality Guidance in ZS Xplorer versions since the introduction of Extended Size analysis will advise of this when it is chosen as the analysis option.
With the introduction of extended size range analysis and the data quality achievable with the ZSU1002 cell, the Zetasizer Advance series can produce accurate particle size distributions for particle sizes that would not otherwise have been allowed. This analysis can be used to characterize a mixture of samples and assess the presence of much larger material, however, due to competing noise artefacts, particles larger than 10 µm will always be reported with compromised accuracy. This data may however be used to infer information about contamination and sample quality otherwise not visible in traditional dynamic light scattering measurements.
[1] – V. Ruseva, H. Jankevics, J. Corbett, An optimized filling method for capillary DLS, Methods X, 6, p606-614, (2019).
[2] - Extended concentration range for side scatter (90˚) DLS using the Low Volume Disposable Sizing Cell, Application note
[3] - Pushing the limits of DLS: Measuring large particles on the Zetasizer Ultra with the Low-Volume Sizing Cell, Application note
[4] – V. Ruseva, M. Lyons, J. Powell, J. Austin, A. Malm & J. Corbett, Capillary dynamic light scattering: Continuous hydrodynamic particle size from the nano to the micro-scale, Colloids and Surfaces A, 558, p504-511 (2018).
[5] – A. Malm, J. Corbett, Improved Dynamic Light Scattering using an adaptive and statistically driven time resolved treatment of correlation data. Sci Rep 9, 13519 (2019).
[6] - Adaptive Correlation: Better insight to the presence of aggregates, Application note