The influence of concentration effects and particle interactions on DLS results is discussed at the example of increasing sample concentration. A roadmap for identifying and distinguishing different types of concentration effects is presented that may influence biotherapeutic product development. [Colloidal stability, Virial effects, hydrodynamic interaction parameter, dynamic Debye plot]
A Malvern Instruments' Bioscience Development Initiative
Dynamic light scattering (DLS) is an analytical technique used to measure the particle size distribution of protein formulations across the oligomer and sub-micron size ranges of approximately 1 nm to 1 µm. The popularity of DLS within the biopharmaceutical industry is a consequence of its wide working size and extended sample concentration ranges, as well as its low volume requirements. With that said, the challenge that remains with the application of DLS to protein therapeutic formulations is centered around data interpretation. In this four-part white paper series, common issues and questions surrounding the principles, measurements and analysis of DLS data are discussed in order to help minimize the time required for and complexity of acquiring and interpreting DLS data that is critical throughout the development process. In this second white paper of the series, we cover the influence of concentration effects and particle interactions on DLS results and provide a roadmap for identifying and distinguishing each type of concentration effect.
Dynamic light scattering (DLS) is an analytical technique used within bioapplications to measure particle size distributions across the oligomer and sub-micron size ranges. Light scattered from a solution of particles will fluctuate with time, due to Brownian motion or diffusion. In a DLS measurement, the scattering intensity fluctuations are correlated across small time spans, yielding the distribution of diffusion coefficients from which the particle size distribution is calculated.
Historically, DLS measurements have been restricted to the analysis of dilute solutions, with published results at the limit of infinite dilution and unexpected (or unexplainable) concentration effects being cast into the catch-all category of "particle interactions". Modern DLS systems, however, can provide diffusion coefficient measurements of samples at very high concentrations, even to the extent of high turbidity or opalescence, and the widespread use of these systems within the bioformulation market have rendered the generic "particle interactions" rationale unacceptable. In fact, bioformulators now quantitate particle interactions by measurement of the DLS interaction parameter (kD) and the second virial coefficient (B22) and then use these properties to screen biotherapeutic candidates and conditions for subsequent stability.
When exploring the influence of sample concentration on DLS analysis of bioformulations, there are four issues that need to be considered: multiple scattering, restricted diffusion, reversible self-association, and electrostatic repulsion. Each of these effects can be identified during the course of a concentration-dependent DLS experiment.
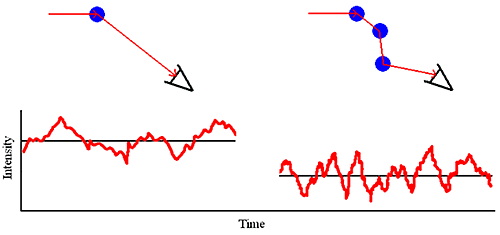
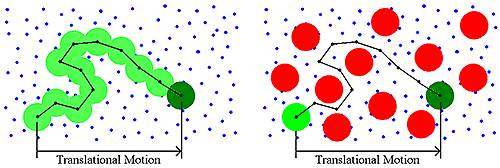
As the sample concentration is increased, the probability that a scattered photon will interact with another macromolecule and be rescattered increases (Figure 1). This rescattering effect is called multiple scattering.
|
Multiple scattering can easily be identified during the course of a DLS dilution experiment. Symptoms of multiple scattering include the following:
As the sample concentration is increased,
From the standpoint of sizing measurements, it is the latter point that is the most important. For samples exhibiting multiple scattering, an increase in sample concentration will lead to an apparent decrease in the mean size and often an apparent increase in the polydispersity or distribution width.
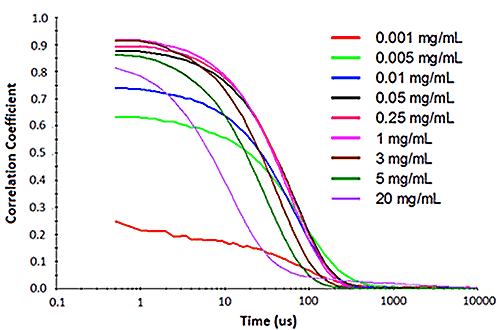
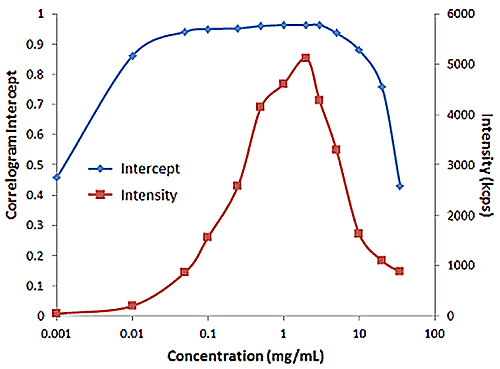
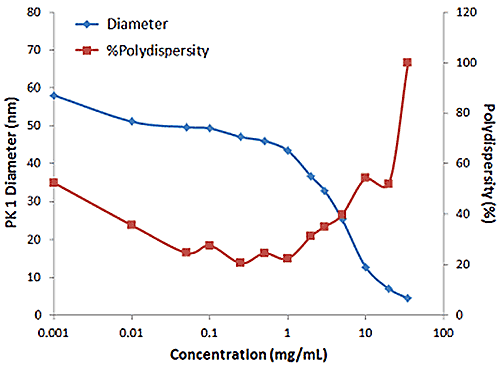
Figure 2 shows an example of the influence of multiple scattering on the DLS results for a PEGylated biotherapeutic. Under ultra-dilute conditions (< 0.01 mg/mL), the low scattering intensity results in a reduced correlogram intercept, as well as an increase in the apparent polydispersity of the distribution. In the dilute regime of ~ 0.01 mg/mL to 2 mg/mL, the expected increase in scattering intensity with sample concentration is observed, with the correlogram intercepts in the desired region of ~ 0.9. In the multiple scattering region of > 2 mg/mL, an increase in concentration leads to reductions in the correlogram intercept, the scattering intensity, and the apparent size, as well as an increase in the apparent polydispersity.
|
|
|
The concentration at which multiple scattering occurs is dependent upon the size of the particle being measured. Unfortunately, there is no clear delineation between samples exhibiting only single scattering and those exhibiting multiple scattering, but rather a gray area where the magnitude of multiple scattering becomes sufficient to influence subsequent size calculations.
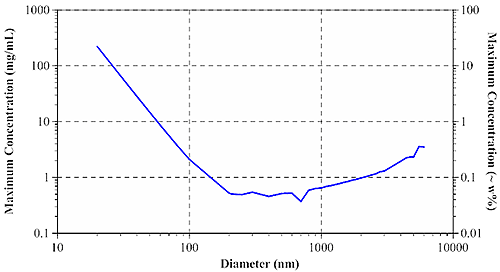
At the diffuse, highly concentrated limit, photons can be considered to undergo a 'random walk' through the sample. According to Pine and Weitz (chapter 16 in "Dynamic Light Scattering: The Method and Some Applications" ed. Wyn Brown, 1993), the diffusive limit of multiple scattering is governed by the photon mean free path, or the distance which an average photon travels in a sample before encountering a scattering particle. Using Mie theory, it is possible to calculate the mean free path when the particle diameter, refractive index of particles and dispersant, laser wavelength, and sample concentration are all known. The mean free path measurement then defines the concentration & size dependent minimum particle separation distance for single scattering samples. Figure 3 shows the size dependence of the maximum sample concentration for single scattering DLS using a 633 nm laser, for aqueous protein systems.
|
For typical protein samples with diameters of < 20 nm, the maximum concentration for single scattering is in excess of 200 mg/mL. For larger aggregates and other biopolymers, the maximum concentration drops off quickly, leveling out at around 0.5 mg/mL or 0.05 w% for particles greater than approximately 200 nm in diameter.
Modern backscatter systems such as the Zetasizer Nano can often compensate for multiple scattering effects by measuring near the cell wall, thereby minimizing the distance between the scattering center and the detector. Backscatter systems can increase the maximum concentration for single scattering by as much as 20 fold. With that said, backscatter technology works very well for opalescent or opaque samples, where the scattering intensity is large enough to render flare noise insignificant. For water-clear biosamples however, flaring from the cell wall can be significant - large enough in fact to render cell wall measurements problematic.
Brownian motion or diffusion is a result of thermally-driven collisions of solvent molecules with the macromolecule. Resistance to Brownian motion is provided by the viscous drag of the surrounding medium, hence the inclusion of sample viscosity in the Stokes-Einstein equation used to calculate the hydrodynamic size from the measured diffusion coefficient.
Historically, DLS measurements were conducted under dilute solution conditions, and the dispersant viscosity was the parameter used to account for the viscous drag of the medium. As the sample concentration increases though, other macromolecules will impart a viscous component to the surrounding medium (Figure 4). This type of concentration effect is called restricted diffusion.
|
Restricted diffusion effects are easily identified during a DLS dilution experiment. Symptoms of restricted diffusion include the following:
As the sample concentration is increased,
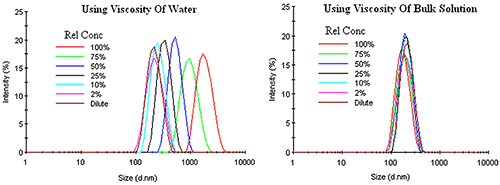
Unlike other types of concentration effects, restricted diffusion effects can be corrected by using the bulk viscosity, rather than the dispersant viscosity, in the Stokes-Einstein equation. Figure 5 shows an example of this correction for an emulsion exhibiting restricted diffusion effects. Under dilute conditions, where the sample viscosity can be represented by the dispersant viscosity, no change in the DLS distribution is observed up to a relative concentration of about 10%. As the concentration is increased, the macromolecule contribution to the sample viscosity adds a determinant error to the DLS results, with the distribution shifted toward larger particle sizes with no change in width or modality, if the dispersant viscosity is used in the Stokes-Einstein calculations. Use of the sample or bulk viscosity however, corrects for restricted diffusion effects, yielding results which indicate an absence of any concentration effects within the emulsion.
|
The 2nd virial coefficient (B22) is a thermodynamic parameter representative of the pair-wise interaction potential between neighboring proteins in a bioformulation. While the interaction potential would include all types of interactions, for protein formulations electrostatic interactions tend to dominate. As such, they're relatively easy to recognize when examining concentration effects on DLS measurements.
Negative virial coefficient values are indicative of attractive interactions, with studies showing strong empirical correlations between B22 and the protein aggregation rate and solubility. Positive virial coefficient values are indicative of repulsive interactions, with the macromolecules preferring solvation over self-association.
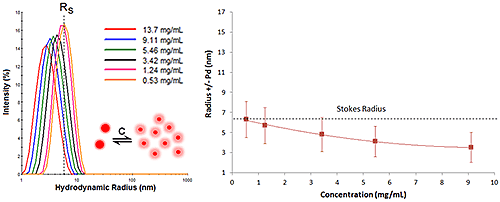
Proteins with negative virial coefficient values will often exhibit reversible self-association - reversible in that dilution leads to dissociation. This type of concentration effect is often referred to as an attractive virial effect, in that the macromolecule prefers self-association over solvation. While DLS cannot resolve oligomeric species, the R6 dependence of the scattering makes DLS very sensitive to subtle changes in the oligomeric distribution. As such, attractive virial effects are easily identified during a DLS dilution experiment. Symptoms of attractive virial effects include the following:
As the sample concentration is increased, The mean size and width of the distribution increases, due to the formation of oligomeric species.
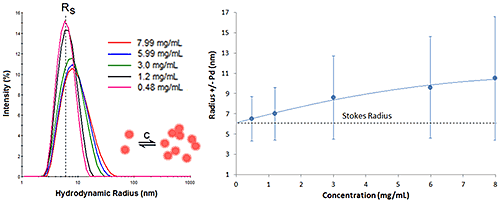
Figure 6 shows the DLS dilution results for an antibody sample exhibiting reversible self-association or attractive virial effects, after bulk viscosity corrections for restricted diffusion effects. The dashed lines represent the Stokes radius, defined as the hydrodynamic radius in the limit of infinite dilution, i.e. in the absence of concentration or particle interaction effects. As shown in this example, an increase in sample concentration leads to an increase in both the mean size and the peak width, indicative of reversible self-association.
|
Proteins with positive virial coefficient values will often exhibit electrostatic repulsion. As this repulsion tends to minimize aggregation, repulsive or positive virial coefficient effects tend to be indicative of colloidal stability. Identifying repulsive virial effects during a DLS dilution study can be tricky for new DLS users. The key is to remember that DLS measures particle motion. Consider, for example, the following exercise:
Begin with a collection of charged particles, all with the same net charge. As particles are added to the fixed volume, or the particle concentration is increased, the separation distance between the particles must decrease. This action forces the charged particles closer together, which subsequently increases the electrostatic repulsive forces between the neighboring particles. As the repulsive forces increase, so too does the baseline energy of the macromolecules, which leads to an increase in their diffusive motion, and a decrease in their apparent size as measured by DLS. So for systems exhibiting repulsive virial effects, one would expect the following from a DLS dilution study:
As the sample concentration is increased,
The size distribution will shift toward smaller sizes, due to the increased repulsive forces between neighboring particles and the subsequent increase in diffusive motion.
The peak modality and width should remain relatively constant, since the increased baseline energy will be distributed equally across the sample.
Figure 7 shows an example of DLS dilution results for an antibody sample exhibiting repulsive virial effects. As expected from the exercise above, the DLS size peak shifts toward smaller sizes as the sample concentration is increased, with no change in peak modality or width.
|
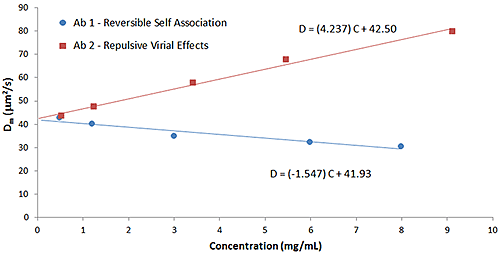
Particle interactions are often quantified using the DLS interaction parameter (kD), which is derived from the slope of a Dynamic Debye plot of the concentration dependence of the measured diffusion coefficient (D). As discussed early in this paper, empirical correlations between the DLS interaction parameter and protein aggregation rates, formulation viscosity, and API solubility have been reported, and the parameter is now routinely used for the purposes of screening biotherapeutic candidates and formulations, under dilute conditions, for indications of subsequent stability at high concentration. The predictive value of kD is a consequence of the influence of the 2nd virial coefficient (B22) on kD, as indicated in the expressions shown below, where D0 is the self-diffusion coefficient at the limit of zero concentration (C) from which the Stokes radius is derived, B22 is the 2nd virial coefficient, MW is the molecular weight, kf is the 1st order concentration coefficient of the friction coefficient, and υ is the partial specific volume.
D=D0 (1+kDC)
kD=2B22MW-(kf+2υ)
The influence of B22 on kD can be observed in Figure 8, which shows a comparison of the Dynamic Debye plots for the antibody formulations in Figure 6 (reversible self-association) and Figure 7 (repulsive virial effects). As discussed earlier, positive B22 values are indicative of samples with a preference toward solvation, rather than self-association, whereas negative B22 values are indicative of samples with a propensity to self-associate. As seen in the Dynamic Debye plots shown below, the antibody formulation exhibiting reversible self-association has a negative kD value, whereas the formulation exhibiting stabilizing repulsive virial effects has a positive kD value - consistent with B22 predictions.
|
Carpenter, Randolph, Jiskoot, Crommelin, Middaugh, & Winter "Potential inaccurate quantitation and sizing of protein aggregates by SEC", J. Pharm. Sci. 2010, 99(5), 2200-2208.
Engelsman, Garidel, Smulders, Koll, Smith, Bassarab, Seidl, Hainzl, & Jiskoot "Strategies for the assessment of protein aggregates in pharmaceutical biotech product development", Pharm. Res. 2011, 28(4), 920-933.
Li, Mach, & Blue "High throughput formulation screening for global aggregation behaviours of three monoclonal antibodies", J. Pharm. Sci. 2011, 100(6), 2120-2135.
Mattison, Nobbmann, & Dolak "The Role Of The Hydrodynamic Radius In Biomolecular Characterization", American Biotechnology Laboratory 2001, Feb, 66.
Pine and Weitz (chapter 16 in "Dynamic Light Scattering: The Method and Some Applications" ed. Wyn Brown, 1993),
Pecora "Dynamic Light Scattering: Applications of Photon Correlation Spectroscopy", Plenum Press, 1985.
Schmitz "An Introduction To Dynamic Light Scattering By Macromolecules", Academic Press, New York, 1990.
Sun, Deluca, & Mattison "The size and rheology characterization of concentrated emulsions", American Laboratory 2005, 37(13), 8-9
Yadov; Liu; Shire; & Kalonia "Specific interactions in high concentration antibody solutions resulting in high viscosity", J. Pharm. Sci. 2010, 99(3), 1152-1168.
Wyn Brown, editor, "Dynamic Light Scattering: The Method and Some Applications", Clarendon Press, Oxford, 1993
Zolls, Tantipolphan, Wiggenhorn, Winter, Jiskoot, Friess, & Hawe "Particles in therapeutic protein formulations, Part 1: Overview of analytical methods", J. Pharm. Sci. 2012, 101(3), 914-935.
"Application of dynamic light scattering (DLS) to protein therapeutic formulations: part I - basic principles". Inform White Paper. Malvern Instruments Limited.
"Application of dynamic light scattering (DLS) to protein therapeutic formulations: part III - DLS deconvolution algorithms". Inform White Paper. Malvern Instruments Limited.
"Application of dynamic light scattering (DLS) to protein therapeutic formulations: part IV - frequently asked questions"". Inform White Paper. Malvern Instruments Limited.
"A basic guide to particle characterization". Inform White Paper, Malvern Instruments Limited.
"Developing a bioformulation stability profile". Inform White Paper, Malvern Instruments Limited.
Malvern Instruments' Bioscience Development Initiative was established to accelerate innovation, development, and the promotion of novel technologies, products, and capabilities to address unmet measurement needs in the bioscience market.