Dynamic light scattering (DLS) is a widely accepted technique for characterizing the hydrodynamic radius of nano-scale materials in suspension. The application of DLS measurements to the analysis of protein therapeutics has increased dramatically over the last ten years and the technique is now considered a staple of analytical technology in the biopharmaceutical sector. The ability of DLS to measure formulation-level concentrations, coupled with its inherent sensitivity to large particles, make it the perfect tool for the study of protein aggregation in solution.
Raman spectroscopy is capable of delivering detailed structural information about protein formulations, through access to secondary and tertiary structural markers. Band intensity changes, broadening, and shifts can all be directly assigned to protein structural changes as a function of stress and environment. Such structural changes are often precursors to aggregation, and can be probed directly with Raman spectroscopy.
The combination of DLS and Raman spectroscopy offers the ability to measure changes in size concurrent with changes in molecular structure. This allows the balance between protein aggregation and protein structural changes to be investigated as a function of changing formulation conditions. Rate constants for the underlying aggregation and structural changes can be derived directly from the resulting data.
Aggregation and native-state unfolding in protein formulations is of critical importance to manufacturers and patients alike. Product quality and safety concerns require both an understanding of aggregation and careful monitoring for long-term problems that may be directly impacted by formulation stability. Studies combining DLS and Raman spectroscopy are perfectly suited to explore the phenomenon of aggregation concurrently with protein unfolding, particularly when these techniques are combined in a single instrument.
Various mechanisms have been postulated to describe the behavior of protein formulations as a function of time, often with incubation at elevated temperature as a proxy for long-term storage. These mechanisms include surface charge repulsion[1] and partial unfolding of the protein to expose functional areas to the solvent and other monomers. This work presents an investigation of the time dependence of incubation at elevated temperature for a series of BSA formulations of different pH. The evolution of aggregation will be monitored by DLS, while protein unfolding will be tracked by measuring secondary structure through Raman spectroscopy, all in a single experiment.
Malvern Instruments' Zetasizer Nano(ZSP) has been integrated with a fiber-coupled Raman spectrometer to obtain DLS (colloidal stability) and Raman (conformational stability) data sequentially on a single sample. The Zetasizer Nano system integrates proprietary non-invasive backscatter (NIBS) detector technology with dynamic (DLS), static (SLS) and electrophoretic (ELS) light scattering to measure the hydrodynamic radius of proteins from 0.15 nm to 5 µm, and concentrations from 0.1 mg/mL to >100 mg/mL. Raman spectra are collected using 785 nm excitation (~350 mW) from 150 cm-1 to 1925 cm-1 at 4 cm-1 resolution. BSA samples were prepared at 50 mg/mL concentration in citrate buffer solution at pH 7.1, 5.4, and 4.75 in order to cover a range of environments significantly above, slightly above, and close to the isoelectric point, respectively. Sample aliquots (~120 µL) were placed into a 3 mm quartz cuvette and positioned in a compartment that provides temperature control from 0°C to 90°C ± 0.1°C.
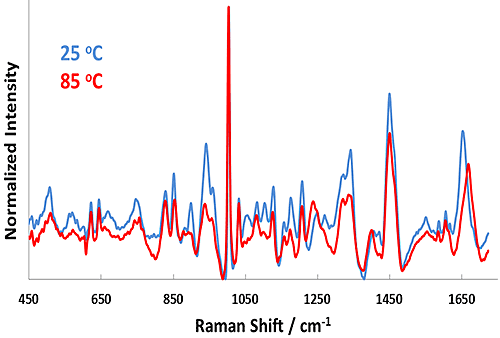
Figure 1 shows representative Raman spectra for the pH 7.1 sample at 25°C and 85°C. Considerable changes in the Raman spectra take place upon heating from 25°C to 85°C, such as in the Amide I (~1650 cm-1) and Amide III (~1250 cm-1) bands. Both of these features indicate secondary structural changes in BSA and evidence of the protein unfolding as temperature is increased. Likewise, the size data reveals a strong shift from ~7 nm (25°C) to 35 nm (85°C) as a function of temperature. This result indicates significant aggregation of the protein by 55°C.
|
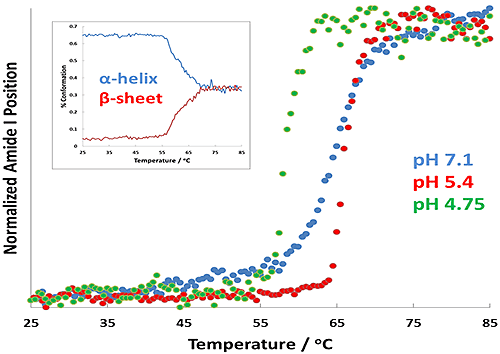
Incubation at a temperature below the transition temperature (Tt) is used to establish a non-equilibrium state where aggregation is preferred and the process can be tracked in real-time. To this end, a series of temperature ramping experiments was carried out in order to establish the Tt at the pHs of interest. The resultant DLS and Raman transition curves were fitted for each formulation to determine their corresponding Tt values. For the Raman data, the region from 1600 cm-1 to 1750 cm-1 was isolated, and the Amide I peak position was determined via band center of mass (CoM) fit, and was used as an indicator of protein unfolding. The physical mechanism is thought to be α-helix to β-sheet conversion of the protein backbone. Figure 2 displays the results of the transitions for each of the formulations.
The results described in Figure 2 show changes in Tt as a function of pH. Of interest is the change in transition temperature between the different samples: the pH 5.4 sample displays the highest Tt, while pH 4.7 displays the lowest. The inset plot shows a full-spectral range PLS prediction for the pH 4.7 sample, and predicts the amount of α-helix and β-sheet structure in the BSA as a function of temperature. The amount of α-helix is seen to decrease rapidly as the transition temperature of BSA is reached, indicating that the BSA is unfolding. Table 1 summarizes the results for size-derived Tt, as well as Tt calculated from the Amide I and Amide III spectral regions.
Thus, Tt for BSA varies from 59°C to 65°C, depending on solution pH. What is also interesting to note from Table 1 is that the onset of aggregation predicted for the pH 4.7 sample from the sizing results is 3°C lower than that predicted for unfolding by the spectroscopy results. This is because the protein solution pH is close to the isoelectric point (pI), where charge-charge repulsions between protein monomers are nonexistent. The protein actually begins to aggregate well before it starts to unfold, which is not the behavior seen in the other buffers.
| BSA | Size (nm) | Amide I (°C) | Amide III (°C) |
|---|---|---|---|
| pH 7.1 | 64.5 | 64.8 | 64.6 |
| pH 5.4 | 64.4 | 66.1 | 66.6 |
| pH 4.7 | 56.5 | 59.6 | 59.6 |
|
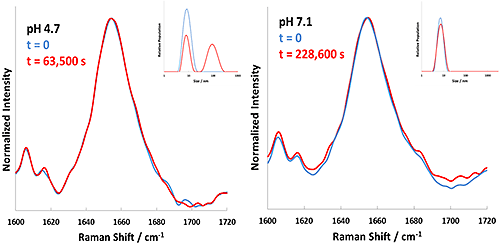
The results summarized in Table 1 indicate 60°C as a starting point to examine the aggregation kinetics of these BSA formulations. To this end, each formulation was incubated at 60°C, with DLS and Raman data being collected consecutively every 5 minutes. Selection of 60°C ensures that the incubation takes place slightly below Tt for BSA in the pH 7.1 and pH 5.4 formulations. The experiment conducted at 60°C for BSA at pH 4.7 showed instant precipitation of 'flaky' white material - aggregation of BSA under these conditions was faster than could be measured. Figure 3 summarizes the Raman spectral data and DLS data collected for the pH 5.4 and 7.1 formulations at 60°C.
Of note in Figure 3 are the substantial differences in behavior of the formulations. At pH 5.4 (left panel), the BSA formulation shows virtually no spectral changes after 7.7 hours of incubation at 60°C, but shows a large change in the reported size from DLS (left inset). This result suggests that aggregation close to the pI takes place in the absence of structural changes in the protein, similar to the result seen at the pI (pH 4.7). BSA at pH 7.1 (right panel) shows both substantial spectral changes and a lesser degree of aggregation (right inset) after 7.7 hours of incubation at 60°C. Evolution of the Raman spectrum shows α-helix to β-sheet conversion, tracking the unfolding of the protein as incubation proceeds. It should be noted that the observed size changes after 7.7 hours are from 7 nm to 35 nm (pH 7.1) and to 450 nm (pH 5.4). Additionally, the unfolding and size kinetics closely track one another for the pH 7.1 sample (Figure 4, below), demonstrating that aggregation and protein unfolding are concurrent at a point far from the pI.

|

|
Thus, for the two samples measured below the transition temperature, we see unique behavior. At pH 7.1, far from the pI, the Z-average size of the BSA tracks the unfolding of the protein. Interestingly, this strongly suggests that the protein is unfolding to a much larger size, but is not aggregating appreciably. It could also suggest a relatively minor degree of aggregation, but the similarities between the spectral and size trends is striking. At pH 5.4, near the pI, the protein is not unfolding, but is aggregating to very large sizes.
Figure 5 displays a similar set of results for BSA in pH 7.1 and 4.7 formulations at 50°C incubation.
|
The results after incubation at 50°C show no observable changes for the pH 7.1 sample. The pH 4.7 sample displays a substantial increase in Z-average size (~20 nm after 20 hours incubation), but no obvious changes in the Raman spectrum. The lack of striking changes is not unexpected, as this temperature is considerably below Tt for both formulations. The result does show that aggregation occurs without structural changes for the pH 4.7 formulation, similar to the pH 5.4 formulation at 60°C incubation.
To further explore the aggregation kinetics, the CoM of the Amide I band was calculated from the Raman spectra, which should serve as an indication of the degree of unfolding of BSA. Figure 6 shows the results of the CoM analysis.
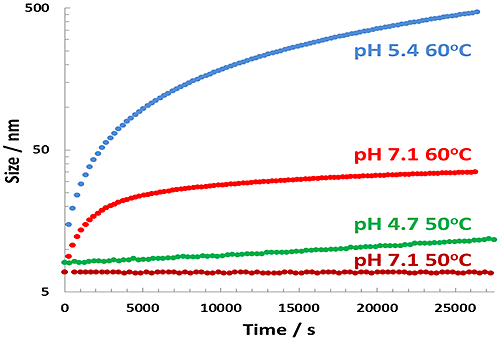
The evolution of the Amide I band over time gives a clear picture of the unfolding of BSA under isothermal incubation. The pH 7.1 60°C sample indicates a Raman shift of nearly 1.5 cm-1 over 7.7 hours, the largest change seen in the spectroscopy. The pH 5.4 60°C sample shows a more modest shift of 0.25 cm-1, while the other samples show no change over the time period. These results are in good agreement with an earlier study by Militello, et al. [2]. It should be noted that the pH 4.7 50°C result is offset by 0.35 cm-1 and the pH 7.1 50°C sample is offset by 1 cm-1 for clarity. Each of the bands has been fit to a single exponential kinetic model to provide a rate constant for unfolding, k, summarized in Table 2.

|
A similar analysis can be carried out for the Z-average size data for each formulation, as shown in Figure 7.
|
Results for the pH 7.1 60°C sample were mentioned earlier, and show a modest change in size that is thought to be due to BSA unfolding. The pH 5.4 60°C sample shows the largest change in size due to aggregation of the BSA, while the pH 4.7 50°C sample shows a slight increase in size. The pH 7.1 50°C shows no change in reported size. Each of these curves was also fitted to a single exponential and summarized in Table 2.
The rate constants derived from the DLS and Raman data complete the description of the aggregation and unfolding kinetics. Far from the pI, such as for the sample at pH 7.1, BSA unfolds relatively rapidly near Tt (60°C) as seen in the Raman spectra. A concurrent, but small, change in size is also seen, suggesting that BSA is unfolding and not aggregating under these conditions. Examination further from Tt (50°C) for the same formulation shows no changes in either the size or the structure, and the solution is taken to be inherently stable under these conditions. At pH 5.4, close to the pI, BSA is seen to aggregate rapidly, with slower unfolding close to Tt (60°C). At pH 4.7, at the pI and above Tt (60°C), BSA is seen to aggregate instantaneously. Below Tt (50°C) at pH 4.7 BSA is seen to aggregate slowly, with no measurable spectral changes. Thus, as the effective charge of BSA approaches zero, the protein is free to aggregate and appears to do so rapidly. Unfolding of the protein is preferred further from the isoelectric point.
| pH / T | Size | Amide I |
|---|---|---|
| k / s-1 | k / s-1 | |
| 5.4 / 60°C | 6.22 x10⁻⁴ | 8.66 x10⁻⁵ |
| 7.1 / 60°C | 1.53 x10⁻⁴ | 1.08 x10⁻⁴ |
| 4.7 / 50°C | 1.78 x10⁻⁹ | - |
| 7.1 / 50°C | - | - |
The ability to quickly collect both size and structural data covering a range of BSA formulations has provided a clear picture of the aggregation dynamics of the protein. Far from the pI, the protein monomers are repelled by surface charge and do not aggregate, even after appreciable unfolding. As the pI is approached and surface charge decreases, aggregation becomes the dominant behavior, with a small degree of protein unfolding. At the pI, aggregation appears to dominate completely, with no observable unfolding of the protein.
Raman spectroscopy has been combined successfully with DLS in order to measure changes in protein structure concurrent with changes in protein hydrodynamic radius. The combined method ensures that samples are measured under identical conditions on a single platform, guaranteeing the closest possible experimental conditions for the measurements. The technique has demonstrated the ability to describe both aggregation behavior and protein unfolding kinetics in a single experiment, leading to improved understanding of the interplay between these two processes. In addition, rate constants for aggregation and protein unfolding have been extracted directly from the experimental results.
Malvern Instruments' Bioscience Development Initiative (BDI) was established to accelerate innovation, development and the promotion of new technologies, products and capabilities to address unmet measurement needs in the biosciences markets.