Lysozyme is a readily available serum protein - an enzyme containing 129 amino acids that is found in many fluid bodily secretions. It is a natural bactericide first identified as such by Alexander Fleming in 1922 [1]. It functions by cleaving the polysaccharide chains forming the bacterial cell wall [2].
Proteins become charged in solution through ionization of the carboxyl and amine groups that are present in the various amino acids making up the molecule [3]. These charges govern the interactions between molecules, particularly at high concentrations, and are therefore important in predicting aggregation behavior and determining appropriate conditions for storage, crystallization and other processing parameters.
Light scattering in general is a powerful tool for the measurement of dispersions or solutions of proteins [4]. Absolute molecular weight is accessible by static light scattering (SLS), diffusion coefficient and therefore hydrodynamic size by dynamic light scattering (DLS), and information relating to surface charge by electrophoretic light scattering (ELS). In this work ELS is used to measure the electrophoretic mobility (EPM) and derive the zeta potential - the potential at the surface of shear where the molecule and its associated sheath of counter ions slip through the solution under the action of the applied electric field [5, 6]. This potential differs from the surface potential due to the presence of ions between the surface and the free solution. However, in the absence of specific absorption that effectively modifies the surface, it is generally proportionally related, and is important because it is the potential that governs electrostatic molecular interactions.
Lysozyme is an ellipsoid of approximately 3.3 x 5.5 nm in size with a molecular weight of 14.7 kDa [7]. This means that it is relatively small in terms of a subject for ELS measurements. The directed motion of ELS is 'smeared out' to an extent by the random diffusion of Brownian motion and the diffusion coefficient for such a small molecule is large (10-10 m2/s). Additionally, since light scattering varies with the 6th power of radius for molecules much less than the illuminating wavelength, the scattering signal is comparatively small. In this work the weakness of scattering was compensated by preparing samples at reasonably high concentrations.
Lysozyme has been the subject of a great deal of research and is readily available. In this work lysozyme derived from chicken egg white (Sigma Aldrich, 99% pure) was used.
The aim of these measurements was to investigate the dependence of zeta potential on pH. The pH was adjusted manually by adding either 0.025 M NaOH or 0.025 M HCl to around 5 ml dispersion of 20 mg/ml lysozyme in approximately 0.6mM NaCl.
Zeta potential measurements were made on a Zetasizer Nano ZS using the high concentration zeta potential cell accessory ZEN1010 (figure 1).

|
The small sample volume of the high concentration zeta potential cell enabled individual injections of around 200µl to be used sequentially. The manual titration was performed in both directions starting from a pH of 4 going to 9.43 then returning to 3.03. Three repeat measurements were performed at each pH point. The measurements were made at 25°C. An electric field of 25 V/cm was applied, (40V across the electrode spacing of 16mm).
A sample of the stock solution was measured by DLS on a Zetasizer Nano ZS at 25°C and the main size population was found to be at a hydrodynamic diameter around 4.0nm as expected for lysozyme.
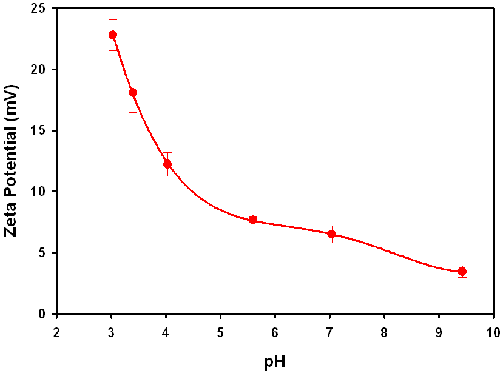
The zeta potential results obtained for lysozyme in the high concentration zeta potential cell are summarized in table 1 and plotted in figure 2. The table shows the zeta potential means (in mV), the standard deviation (in mV) from the three repeat measurements take on each sample, the measured conductivities (in mS/cm) and the pH of each sample. Note that the sign of the zeta potential is positive across the range covered and is dropping steadily in magnitude as the pH increases. This is to be expected as the isoelectric point (IEP - the point of zero zeta potential) is known to be at approximately pH 11 [8, 9]. The values between pH 3.5 and 4.5 also agree with published data [10]. Note however that there is a subtlety here. The point of zero zeta potential may differ from the IEP if absorption of ions to the molecule from solution occurs. Negative values of EPM in the pH range 6 to 10 have been reported [11].
|
| pH | Zeta Potential (mV) | Standard Deviation (mV) | Conductivity (mS/cm) |
|---|---|---|---|
| 3.03 | 22.8 | 1.27 | 1.41 |
| 3.4 | 18.08 | 1.6 | 0.078 |
| 4.03 | 12.224 | 0.96 | 0.072 |
| 5.6 | 7.648 | 0.32 | 0.068 |
| 7.04 | 6.5 | 0.7 | 1.06 |
| 9.43 | 3.44 | 0.48 | 0.67 |
This is an indication that in those measurements, some available anionic species had become attached to the lysozyme surface. It is generally accepted that measurements on cationic species are challenging simply because many moieties present, even in small concentrations, are likely to be negatively charged and attracted to a positive surface. These would include traces of surfactants used in cleaning for example. Performing the measurements at a relatively high concentration can assist in avoiding these effects.
Measurements were also conducted at higher ionic strength (nominally 0.15M NaCl) over a limited pH range. The values obtained are summarized in table 2. The reduction in magnitude of the zeta potential by higher salt is an example of 'ionic screening' - the ion atmosphere effectively attenuates the effect of the surface charge even without actually adsorbing to the surface. A similar trend of decreasing value of zeta potential as pH is increased was observed.
| pH | Zeta Potential (mV) | Standard Deviation (mV) | Conductivity (mS/cm) |
|---|---|---|---|
| 4.0 | 5.53 | 0.50 | 19.2 |
| 6.4 | 2.45 | 0.04 | 19.1 |
Zeta potential measurements of lysozyme exploiting the low volume capability of the high-concentration zeta potential cell are presented as a function of pH and salt concentration. The values obtained in this study are in agreement with published data.
[1] A. Fleming (1922) Proc. Roy. Soc. Ser. B 93, 306-317.
[2] K. Meyer, J.W. Palmer, R. Thompson and D. Khorazo (1935) J. Bio. Chem. 113, 479-486.
[3] Biochemistry 5th Edition (2002) by L. Stryer, W.H. Freeman & Co.
[4] Dynamic Light Scattering: With Applications to Chemistry, Biology, and Physics (1976) by B.J. Berne and R. Pecora, Dover Publications.
[5] Hunter, R.J. (1988) Zeta Potential In Colloid Science: Principles And Applications, Academic Press, UK.
[6] Measurement and Interpretation of Electrokinetic Phenomena (2005) Pure Appl. Chem. 77, 1753-1805.
[7] C.C.F. Blake, D.F. Koenig, G.A. Mair, A.C.T. North, D.C. Phillips and V.R. Sarma (1965) Nature 206, 757-761.
[8] W. Price, F. Tsuchiya, and Y. Arata (1999) J. Am. Chem Soc. 121. 11503-11512.
[9] R.J. Green, T.J. Su, and J.R. Lu (2001) J. Phys. Chem. B 105, 9331-9338.
[10] A. Bernardo, C.E. Calmanovici and E.A. Miranda (2004) Crystal Growth & Design 4, 799-805.
[11] M. Pérez-Rodríguez, G. Prieto, C. Rega, L.M. Varela, F. Sarmiento, and V. Mosquera (1998) Langmuir 14, 4422-4426.