Polymers are macromolecules made of repeating molecular units. Due to the nature of polymerization reactions, polymers contain a distribution of molecular weights that define their rheological properties like strength, flexibility, brittleness, etc. Important physical properties, such as chemical resistance, solubility, density, permeability are mainly a function of the polymer's repeating unit.
The three moments that characterize the molecular weight distribution are the number average molecular weight, Mn, the weight average molecular weight, Mw and the z-average molecular weight, Mz. The polydispersity of the polymer is defined as Mw/Mn. A bulk polymer will have different properties depending on the molecular weight, but even for polymers with the same average molecular weight, the properties may be different depending on the polydispersity of the polymer.
Polymer blends are often used to optimize the physical and rheological properties of the bulk polymer sample. It is important to characterize the ratio of the constituent polymers as well as the molecular weight and dispersities in order to define these properties. One tool that allows the characterization of polymers in solution is gel permeation chromatography (GPC) also called size exclusion chromatography (SEC). Viscotek is a strong advocate of good chromatography as a prerequisite for GPC data accuracy. By good chromatography, we mean that the separation mechanism in the column is a pure stearic separation of the sample and no column overloading occurs at any time. Recent work involving the characterization of multi-component sample matrices including textile, organic electronics, and bio-pharmaceutical applications has driven the development of a photodiode array (PDA) detector as a diagnostic tool. The PDA, also known as a diode array detector (DAD), is an inline detector that measures the complete absorption spectrum of the sample eluting at every time slice of the chromatogram, giving a fingerprint of the components. The difference in absorption profiles between polymers that may have similar molecular
|
|
weights, refractive index increments, viscosities, or hydrodynamic radii can be significant. This note highlights a new PDA detection method for the analysis of polymer blends.
A blend of 5% polystyrene (PS) and 95% polymethylmethacrylate (PMMA) was prepared. The concentrations are reported in weight %. Each sample was analyzed in duplicate with an injection volume of 100 μL. The total sample concentration was 2 mg ml-1. The eluent was tetrahydrofuran (THF) at a flow-rate of 1 mL min-1. The column and the detectors were held at 30 °C for best reproducibility. The columns used to achieve the desired results were ViscoGEL I-series ( IMBHMW-3078). Normally in GPC , the concentration is measured by an RI detector but in this application note we show the use of a photodiode array (PDA) detector to identify the polymers in the blend using their different absorption profiles.
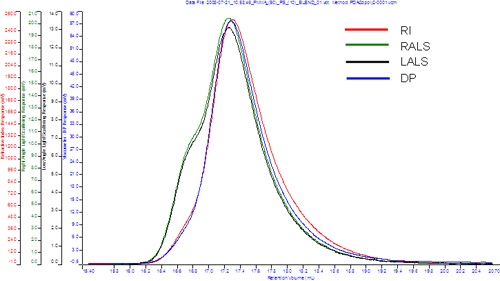
Figure 1 illustrates the typical chromatograms obtained using Viscotek's tetra detection platform. While the RI and viscometer response
|
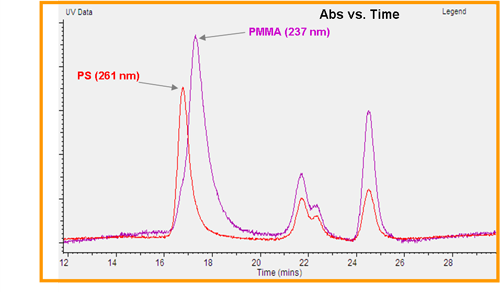
does not clearly show the presence of two components, the light scattering detectors show a small shoulder at the high molecular weight end of the chromatogram. However, it is not certain that there are two components in the sample matrix. This artifact could be due to aggregation, blending or branching. When using Viscotek's PDA detector, it is evident that there are two distinct components. Figure 2, shows the UV absorption chromatograms at 2 different wavelengths, 237 and 261 nm. Since the PDA records the absorption at all the wavelengths simultaneously, for every slice, the absorption of both PMMA (237 nm) and PS (261 nm) were observed and selected post acquisition. Arguably the same could be accomplished with a dual wavelength UV-vis detector online. However, the absorption wavelengths would need to be pre-determined. This may work if only two absorption bands were detected and no monomer, low molecular weight polymer or impurities are competing in the batch UV-vis absorption spectrum. Using the PDA to view the whole spectrum makes it much more convenient to identify the different polymers in a blend. From a qualitative analysis of figure 2, it is evident that the PS component is eluting first, and hence is larger than the PMMA component.
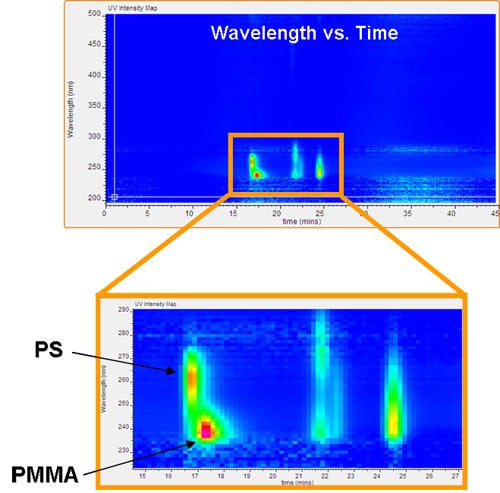
The OmniSEC software offers several ways to visualize and evaluate the PDA data. Figure 3 shows a contour plot comparing absorption wavelength to retention time. It is immediately evident that there are two polymer species within the sample matrix. This conclusion is deduced from the presence of two main absorption peaks, each having a different maximum wavelength and intensity as well as showing up at a different retention time. This supposition is not possible using the RI, LS and viscometry chromatograms as shown in figure 1.
The two wavelengths, 237 and 261 nm presented in figure 2 were selected using the contour plot shown in figure 3.
This gives us the best qualitative overview of the absorption vs time, making the choice of wavelength very easy.
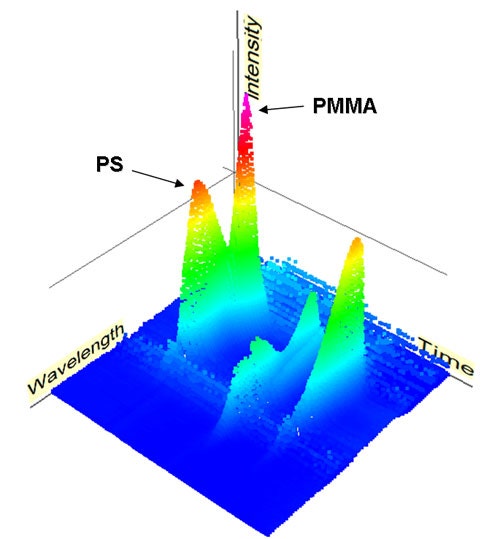
By extending the contour plot into the z-axis, a 3D plot can be analyzed by the user from any angle (Figure 4). It is even clearer looking at the 3D plot that there are two components in this sample. Also revealed are the presence of by-products and unreacted starting material at the low molecular weight end of the chromatogram (long retention times). This is useful for the qualitative analysis of polymerization optimization studies.
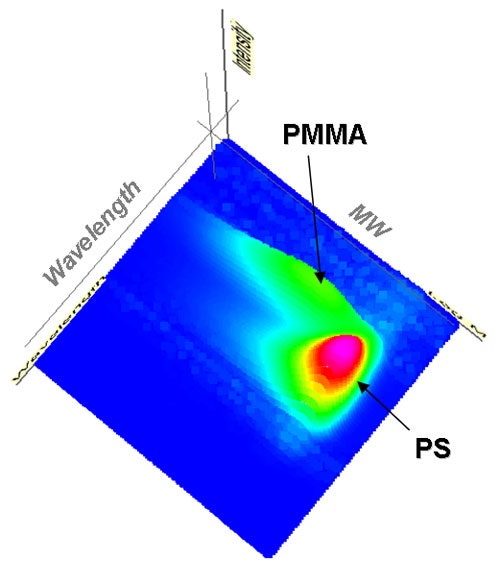
One of the most useful and important diagnostic tools that Viscotek's PDA provides in the characterization of polymers blends is the ability to compare UV-vis absorption to the molecular weight of the sample (Figure 5). For this chromatogram, a blend of PMMA:PS (30:70) was measured. Using Viscotek's advanced detector platform, an absolute molecular weight distribution can be obtained. By plotting this against the PDA data, a nice illustration of the absorption profile within the sample matrix can be obtained. Figure 5 show that the PMMA component has a lower molecular weight and higher polydispersity (Mw/Mn) than the PS component in the blend.
|
|
In conclusion, the use of Viscotek's PDA detector and software for the analysis of polymer blends and their components proves to be a valuable addition to the advanced detection capabilities. The PDA can easily show blends and the flexibility of choosing a wavelength post run makes the instrument very versatile for homopolymers and blends identification and measurements.