
Soil science is a study of the chemical, physical and biological processes that occur in soils. Understanding these processes allows the use of the soil to be optimized for different areas including agriculture, transport systems, recreation and urban developments. For example, sandy soils are good for road building as they provide good drainage where as for agriculture the soil needs to be able to retain a certain amount of moisture and the nutrients within it.
All soils are made up of organic matter, minerals, water and air. The solid content of the soil generally makes up between one half and two thirds of the total volume. Of this solid matter, the proportions of organic matter and minerals will vary depending on the location and use of the soil. The minerals are derived from weathering of the bedrock, and are generally silicates combined with various metal ions.
One particular property of soil which determines its suitability for different uses is texture. These properties include;
Soil texture is dependent on the particle size of the mineral matter in the soil. For example soils containing large particles will provide better draining where as soils containing small particles will retain more liquid. An example of the importance of such a property is the use of fertilizers on the land. If too much fertilizer is used on fast draining soil then the fertilizer may leach into the groundwater and causing environmental damage.
Soil texture is traditionally measured by hand. The technique involves wetting the soil and rolling in the hand, using the feel and behavior of the soil to determine the texture of the soil.
Soil texture can also be determined by measuring the particle size of the mineral matter in the soil. Specifically, texture is related to the relative proportions of three fractions or separates in the soil: the sand, silt and clay. These three fractions of soil are defined by their particle size. The smallest fraction is clay which includes particles smaller than 2μm. Particles in the size range 2μm to 50μm make up the silt fraction. The largest particles in soils are sand particles; this fraction includes any particles larger than 50μm.
As the sand fraction includes anything over 50μm this can be a large volume of material so there are further subdivisions within the sand fraction, see table 1. The sand fraction extends up to 2mm, above which the material is defined as gravel or stones. Material larger than 2mm is not included with the definition of texture.
Table 1: Soil fraction sizes
| Soil fraction | Diameter limits (μm) |
|---|---|
| Clay | <2 |
| Silt | 2 to 50 |
| Very fine sand | 50 to 100 |
| Fine sand | 100 to 250 |
| Medium sand | 250 to 500 |
| Coarse sand | 500 to 1000 |
| Very coarse sand | 1000 to 2000 |
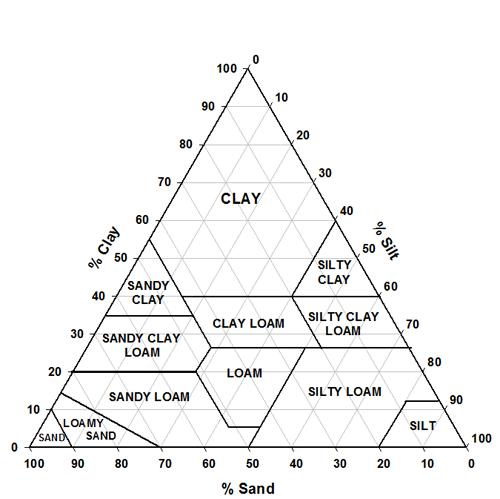
Therefore by measuring the particle size distribution the percentage in each fraction can be determined. Once these three fractions are known then a texture triangle can be use to work out the soil texture. For example a soil containing 40% sand, 56% silt and 4% clay is classified as silty loam.
The texture triangle divides regions with different percentages of the three fractions into texture classes. Figure 1 shows the texture triangle used by the U.S. Department of Agriculture. However, different countries or regions divide up the texture triangle differently depending on the prevalence of different soil types.
Laser diffraction is an excellent technique for measuring the particle size distribution of soils due to the broad size range covered by this technique. The Mastersizer can measure particles sizes in the range 10nm to 3.5mm without the need for optics changes. This easily covers all three soil fractions and allows the soil texture to be determined in one measurement. Other techniques such as sieving will not be able to cover smaller material in the clay fraction and as such often require the combination of results from different techniques.
Laser diffraction determines particle size on the basic principle that large particles scatter light at low angles and small particles scatter light at high angles. The instrument measures the scattered light energy over a range of angles and this can then be resolved into a particle size distribution using a scattering model and the optical properties of the material.
In this application note several different soils have been measured on the Mastersizer to demonstrate how the instrument can be easily used to measure the particle size distribution and the software can be used to determine the soil texture.
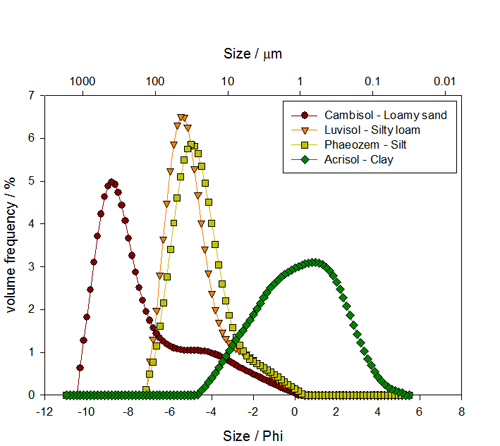
The particle size distributions of four soil samples have been measured using the Mastersizer. These samples represent different types of soil taken from different areas and hence should show different textural properties.
The first sample is a predominantly clay soil, which could be classified as an Acrisol. Such clay rich soils are typically found in humid tropical areas and often support forested areas. The particle size distribution of this sample is shown in Figure 2 from which it can be determined that it is composed of 73% clay, 26% silt and 1% sand giving it a clay texture. Soils with a clay texture will retain moisture and nutrients. However these soils can have poor drainage, becoming saturated with water which makes them difficult to handle and deprives plant roots of oxygen.
The second soil is a Phaeozem, soils of this type are predominantly found in North and South America, as well as subtropical Asia. The composition is characterized by a humus rich surface layer in which, in its natural state, is covered in grass or forest vegetation. A high proportion of organic material makes this soil type highly arable, typically used for wheat, soy beans
|
|
and pasture. The size distribution is shown in Figure 2 where the clay content is 2%, the silt content is 81% and sand content is 17% giving this sample a texture of silt. A soil with a silt texture is likely to have good nutrient retaining capabilities but better drainage due to the slightly larger particle size.
The third sample is a Luvisol. Luvisols are typically found in flat or gently sloping landscapes in cool temperate to warm Mediterranean climates. In terms of composition, Luvisols have mixed mineralogy, high nutrient content and good drainage making them suitable for many types of agriculture from grains to vineyards. The particle size distribution of the Luvisol sample contains approximately 2% clay, 71% silt and 27% sand; this defines the texture as silty loam. The coarser texture of this soil will provide further improved drainage compared to the Phaeozem, which will also make the soil easier to handle.
The final sample is a Cambisol, the second most common soil covering 12% of total continental land area. Cambisols generally have a larger particle size giving a texture of loamy sand or coarser. This material is less than 35% parent rock or coarse material by volume and can be characterized by a lack of accumulated clay. The structure and high mineral content make Cambisols suitable for agriculture. The particle size distribution for the Cambisol shown in Figure 2 which shows a composition of 1% clay, 22% silt and 77% sand giving this sample a loamy sand texture. The coarser texture of this soil means that the soil will be well drained, however this means it will be poorer at retaining nutrients and will require careful addition of fertilizers in order to prevent run off and contamination.
|
|
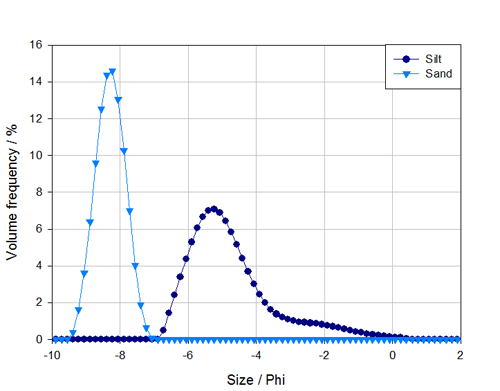
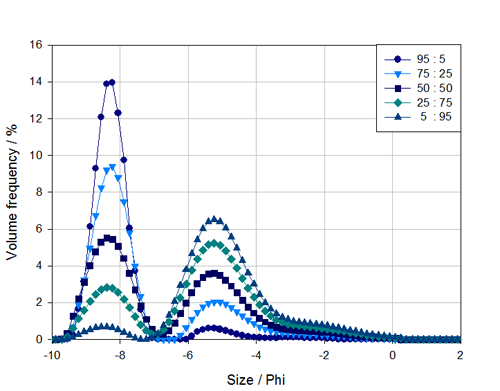
In addition to using the Mastersizer to measure the overall texture of the soil we can also look at the sensitivity of the system to changes in the distribution. This can be achieved by looking at samples made up of known mixtures of silt and sand. The size distributions for the separate sand and silt fractions are shown in Figure 3. The samples which were tested comprise a 50:50 mix of sand and silt as well as 5:95 and 25:75 mass mixtures of sand and silt, and vise versa. The size distributions for these mixed samples are shown in Figure 4. These size distributions can then be used to test how accurately the relative proportions of each fraction are reported by the Mastersizer.
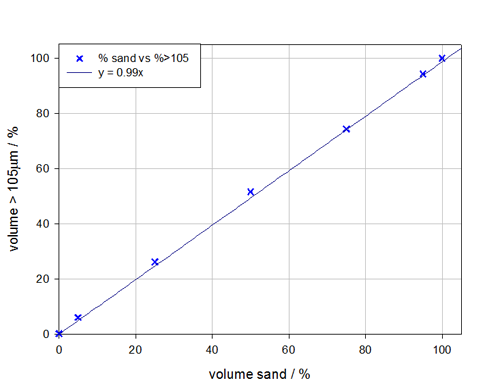
In order to check the proportions of sand and silt in each sample the percentage of material greater than 105μm (-6.7Phi) has been used as the cut off between the two fractions. Figure 5 shows the percentage of material greater than 105μm plotted against the mass of sand added to each mixture. Applying a linear fit to this data shows an excellent agreement between the % volume greater than 105μm and the mass of sand added to the mixture. This is demonstrated by the gradient of 0.99 for the linear fit, and an R2 value of 0.99. Hence the Mastersizer is accurately reporting the volume of material in each fraction, showing sensitivity to small amounts of both the coarse and fine fractions.
In this application note laser diffraction has been used to measure the particle size distribution, and therefore determine the texture, of four different soil types. The dynamic range of the Mastersizer is particularly suited to the analysis of soil as it covers the wide particle size range that are encountered in natural soils from submicron clay to millimeter sized sand.
|
In addition, several samples comprised of mixtures of sand and silt were also measured in order to test the sensitivity of the system to small amounts of the coarse and fine fractions. An excellent agreement was observed between the mass of sand added and the % material over 105μm measured by the Mastersizer.
[1] World reference base for soil resources, FAO, Rome 1998