Calcium carbonate is a versatile material used in applications covering fuels, agriculture, pharmaceuticals, and printing materials. The two methods of production are ground calcium carbonate (GCC) – where chalk,limestone, and dolomite are ground to the desired particle size – and precipitated calcium carbonate (PCC),where calcinated limestone is re-carbonized with carbon dioxide into calcium carbonate. Precipitated calcium carbonate is the method preferred by industry for the ability to create a product with a specified particle size, particle size distribution, surface area, shape, and surface chemistry. In paper and printing material production, calcium carbonate is used as a filler material that offers superior whiteness, brightness, gloss, and printability. It is also a more cost-effective solution when compared to GCC, kaolin clay, and wood pulp. Particle size distribution of PCC affects final coated paper whiteness and brightness through tightly controlled packing densities.
In this application note we show how Insitec LPS 9 (On-line liquid process system) can provide real time particle size distribution data, which provides manufacturers with continuous particle size data allowing early detection of process upsets and reducing the need for protracted offline sample analysis .
Calcium carbonate is a versatile material used in applications covering fuels, agriculture, pharmaceuticals, and printing materials. The two methods of production are ground calcium carbonate (GCC) – where chalk, limestone, and dolomite are ground to the desired particle size – and precipitated calcium carbonate (PCC), where calcinated limestone is re-carbonized with carbon dioxide into calcium carbonate. Precipitated calcium carbonate is the method preferred by industry for the ability to create a product with a specified particle size, particle size distribution, surface area, shape, and surface chemistry. These characteristics are affected by precipitation concentration, temperature, process temperature change, agitation energy, and pH. The market is favorable towards PCC, with global forecasted growth of $15.66 billion to $25.01 billion from 2012 to 2019. The compound annual growth rate (CAGR) for PCC is 3.9% versus a CAGR of 2.9% for GCC, adding to the motivation to use precipitation as a means of production [1].
In paper and printing material production, calcium carbonate is used as a filler material that offers superior whiteness, brightness, gloss, and printability. It is also a more cost-effective solution when compared to GCC, kaolin clay, and wood pulp. Particle size distribution of PCC affects final coated paper whiteness and brightness through tightly controlled packing densities. The final paper product must provide a crisp printed image with good gloss, contrast, and opacity. This relies on the manufacturers ability to produce calcium carbonate with a narrow particle size distribution.
Traditionally, particle size distribution data are collected in a laboratory using a SediGraph instrument. The main motivation for keeping with this technology is that SediGraph data are the industry standard and are the only data trusted by PCC end users. SediGraph is non-ideal for process control since each measurement can take approximately 30 minutes, all the while requiring preparation and analysis by an operator. The lengthy measurement time means that roughly only one in five batches can be sampled in a plant. Malvern Panalytical’s Insitec LPS, on-line Liquid Process System, can provide real time particle size distribution data, which provides manufacturers with up to four data points per second for every batch allowing early detection of process upsets, and reducing sample analysis time and resource.
Malvern Panalytical’s Insitec is a laser diffraction based instrument that produces continuous particle size distribution (PSD) data for particles ranging from 0.1-2500 µm. This technology uses the rigorous Mie Light Scattering Theory to measure sample PSD, and can calculate additional variables including specific surface area (SSA), Blaine, and quartile ratio (D75/D25). The Insitec Liquid Process System is a complete packaged solution designed for easy integration into liquid process lines. The system incorporates direct in-line dilution, making it an ideal solution for streams with high solids loading. The instrument uses the Malvern Link II software package, which allows for easy automation control, data export, and integration into plant SCADA systems. Industry requirements are pushing towards the need for reliable and continuous process analysis.
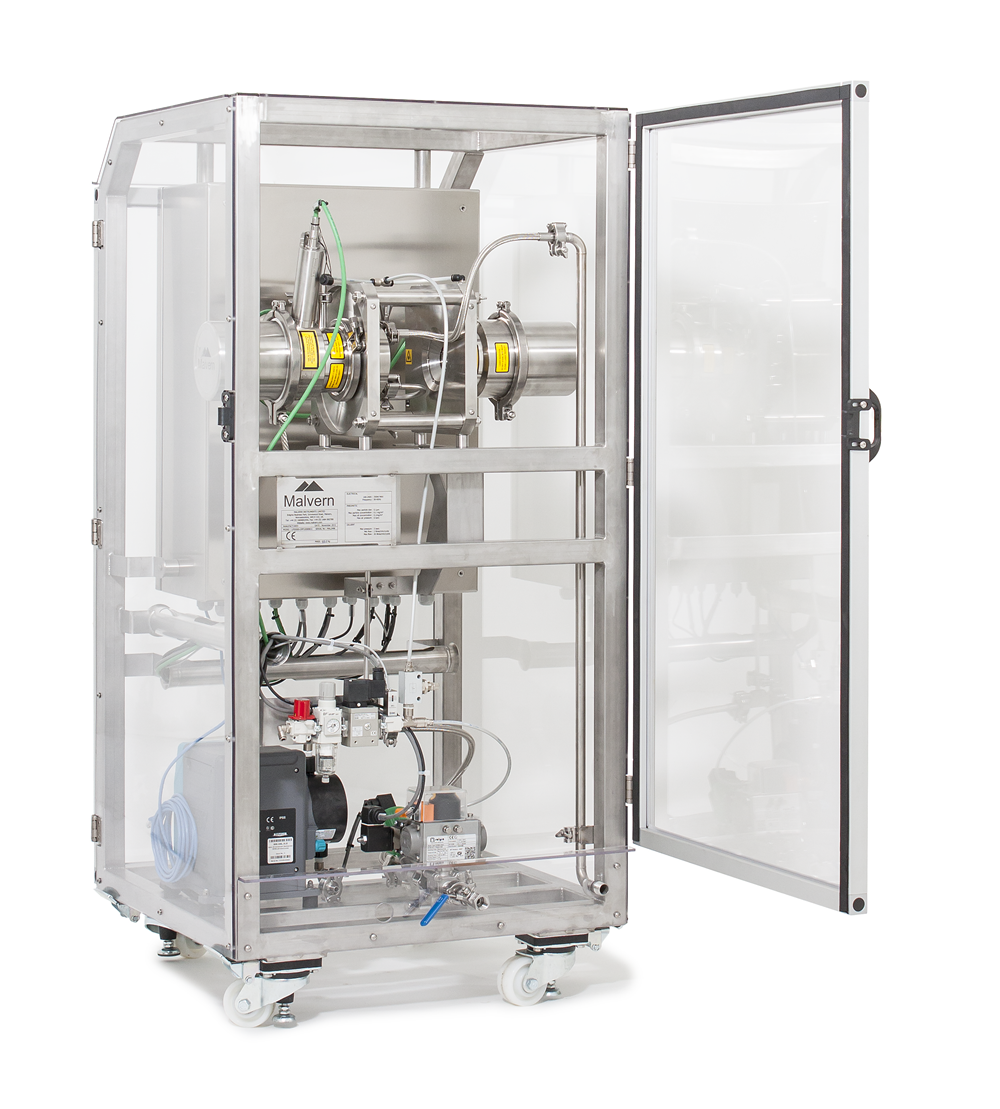
Figure 1 - Insitec LPS uses the established technique of laser diffraction for online particle size analysis in wet processes streams
The Insitec LPS solution addresses three major concerns for precipitated calcium carbonate production by:
The Insitec LPS has been successfully integrated into a multi-line precipitated calcium carbonate process, where it addresses the concerns listed above. The sample line is fed by three reactor tanks, where a combination of automation control through a SCADA suite and Malvern Link II’s internal automation provides fine-tuned multi batch analysis. This sophisticated automation means the instrument can operate 24/7 with minimal operator interference. Routine maintenance, such as flushing the lines to clear the optics, can also be automated. Each batch from the three tanks is set to a signal trigger from the tanks release. This signal starts the cascade to open the correct process flow line, initialize a measurement, and perform a post flush once enough data are collected. Data are continuously exported to the operator’s control hub, where trends can be tracked real time. Process upsets, such as material blockage or product quality issues, are made immediately apparent and can be tied to system alarms to draw operator focus only when needed. Data from several batches are shown in Figure 2, which shows the transition from coarse material production to fine material production.
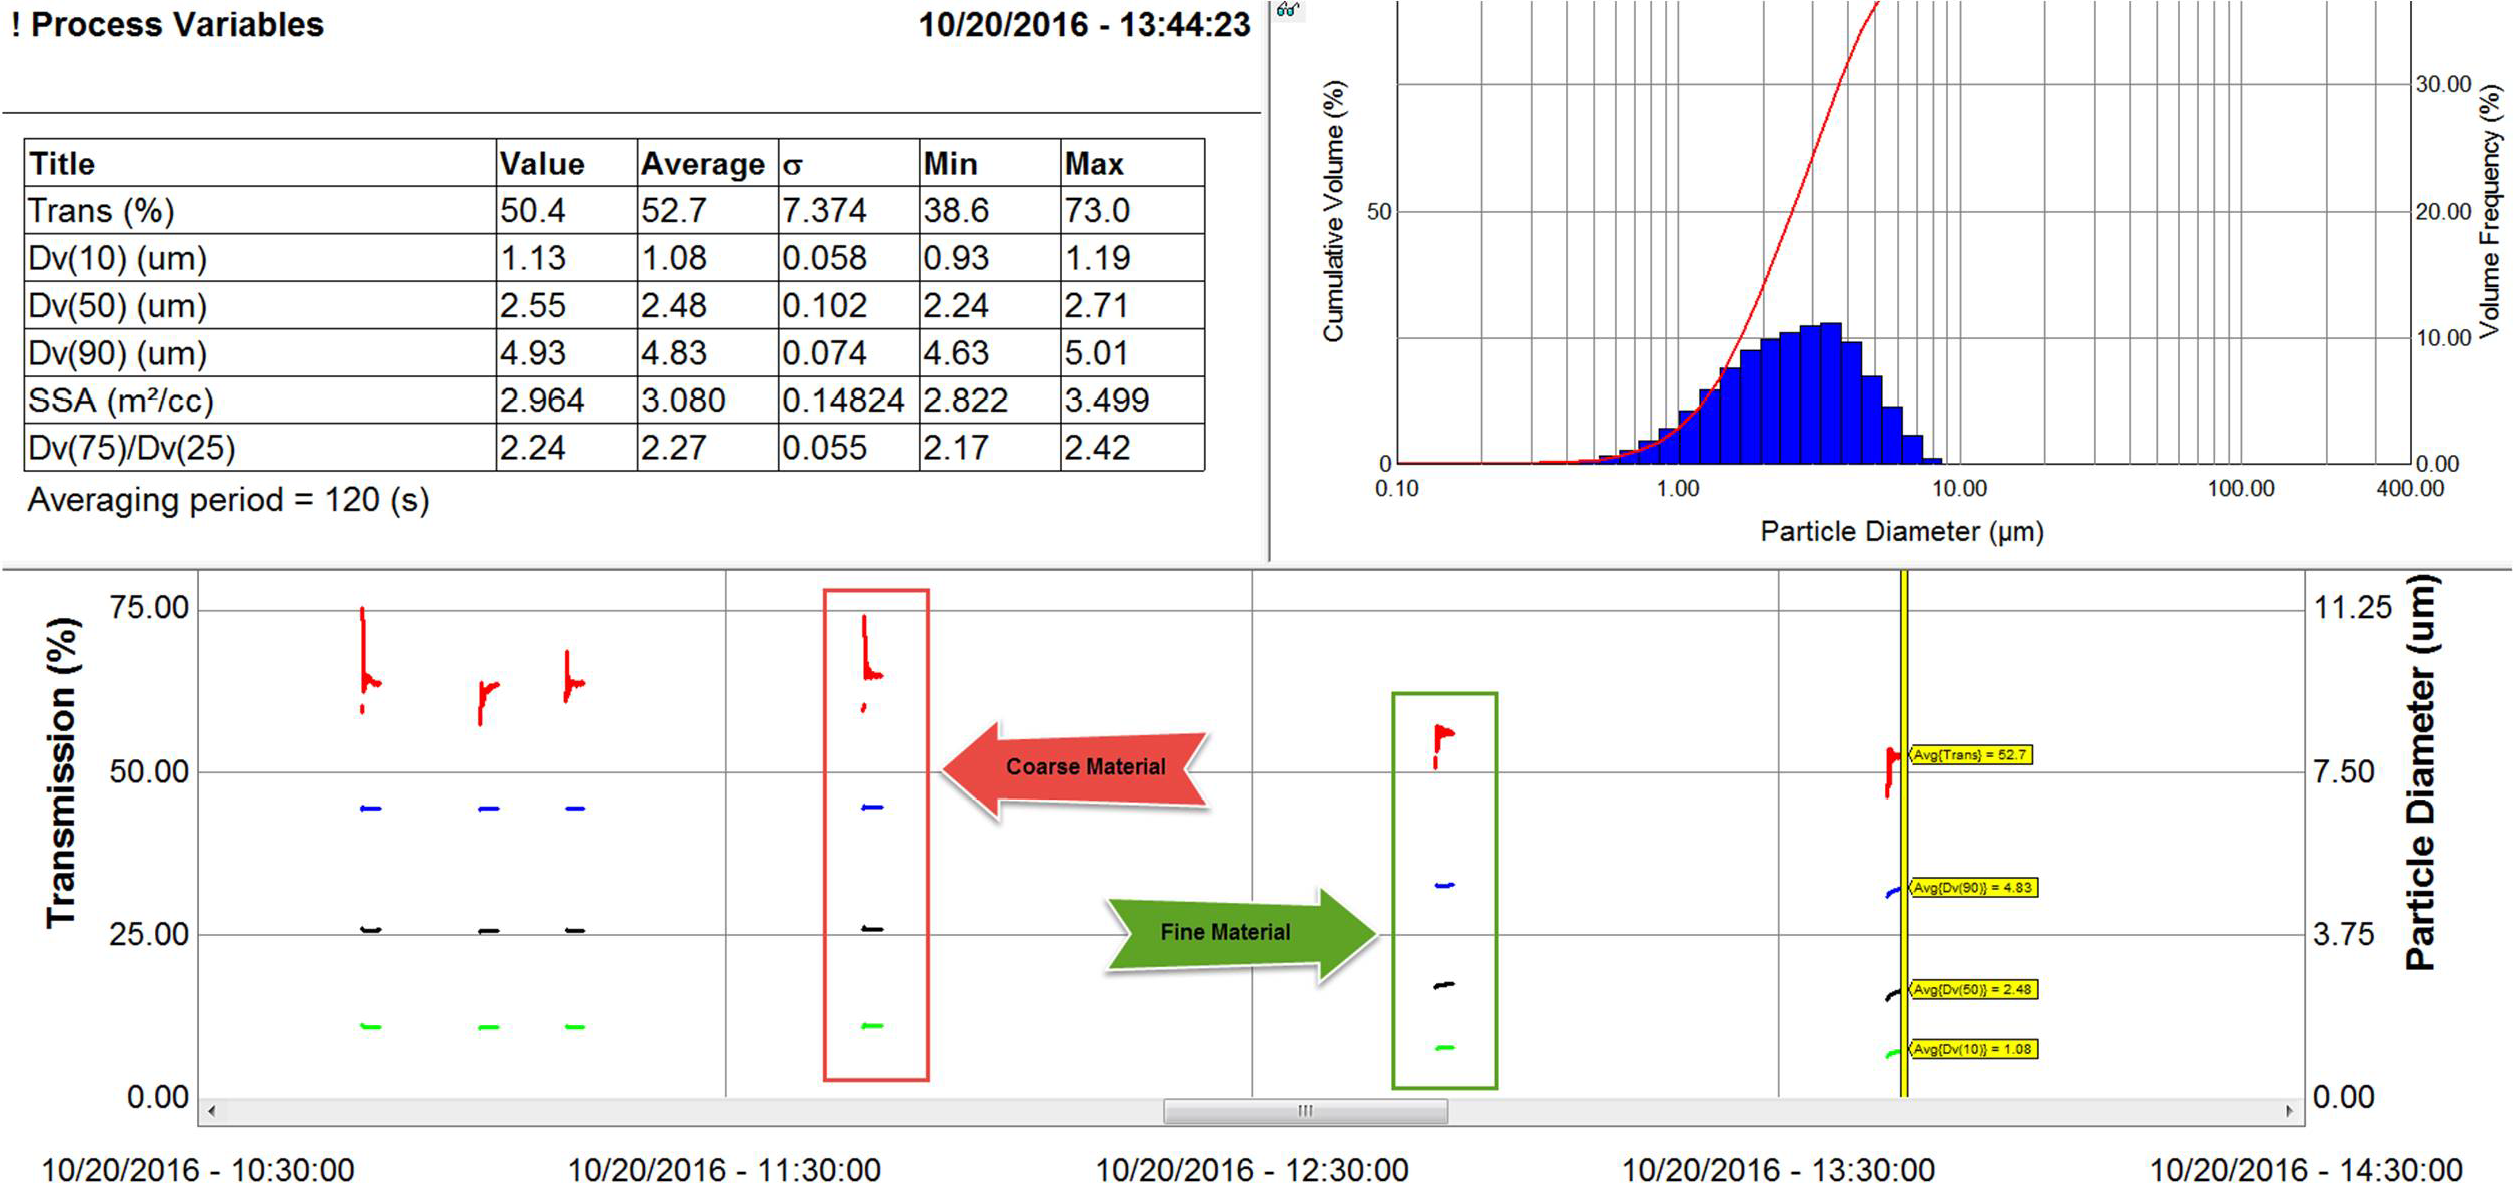
Figure 2 - Precipitated calcium carbonate data shown in RTSizer software. Top left: Custom list of process variables. Top right: Cumulative particle size distribution plot. Bottom: Real time data plot, highlighting change from coarse to fine material.
While this process change was intentional, it could just as easily represent a production test, where the quantitative effect of altered pH, reaction time, temperature, agitation energy, or rate of carbon dioxide addition could be analyzed in real time. The RTSizer analysis software allows for custom variable reporting, where the process variables of interest can be plotted vs. time as shown in Figure 2. Batch to batch comparisons are made easy when a full report of data is produced for each run, and the above data represents a considerable increase in accrued data when comparedto SediGraph, where only 1 in 5 of the above measurements could be completed. Figure 3 shows a comparison of the coarse and fine cumulative particle size distributions highlighted in Figure 2.
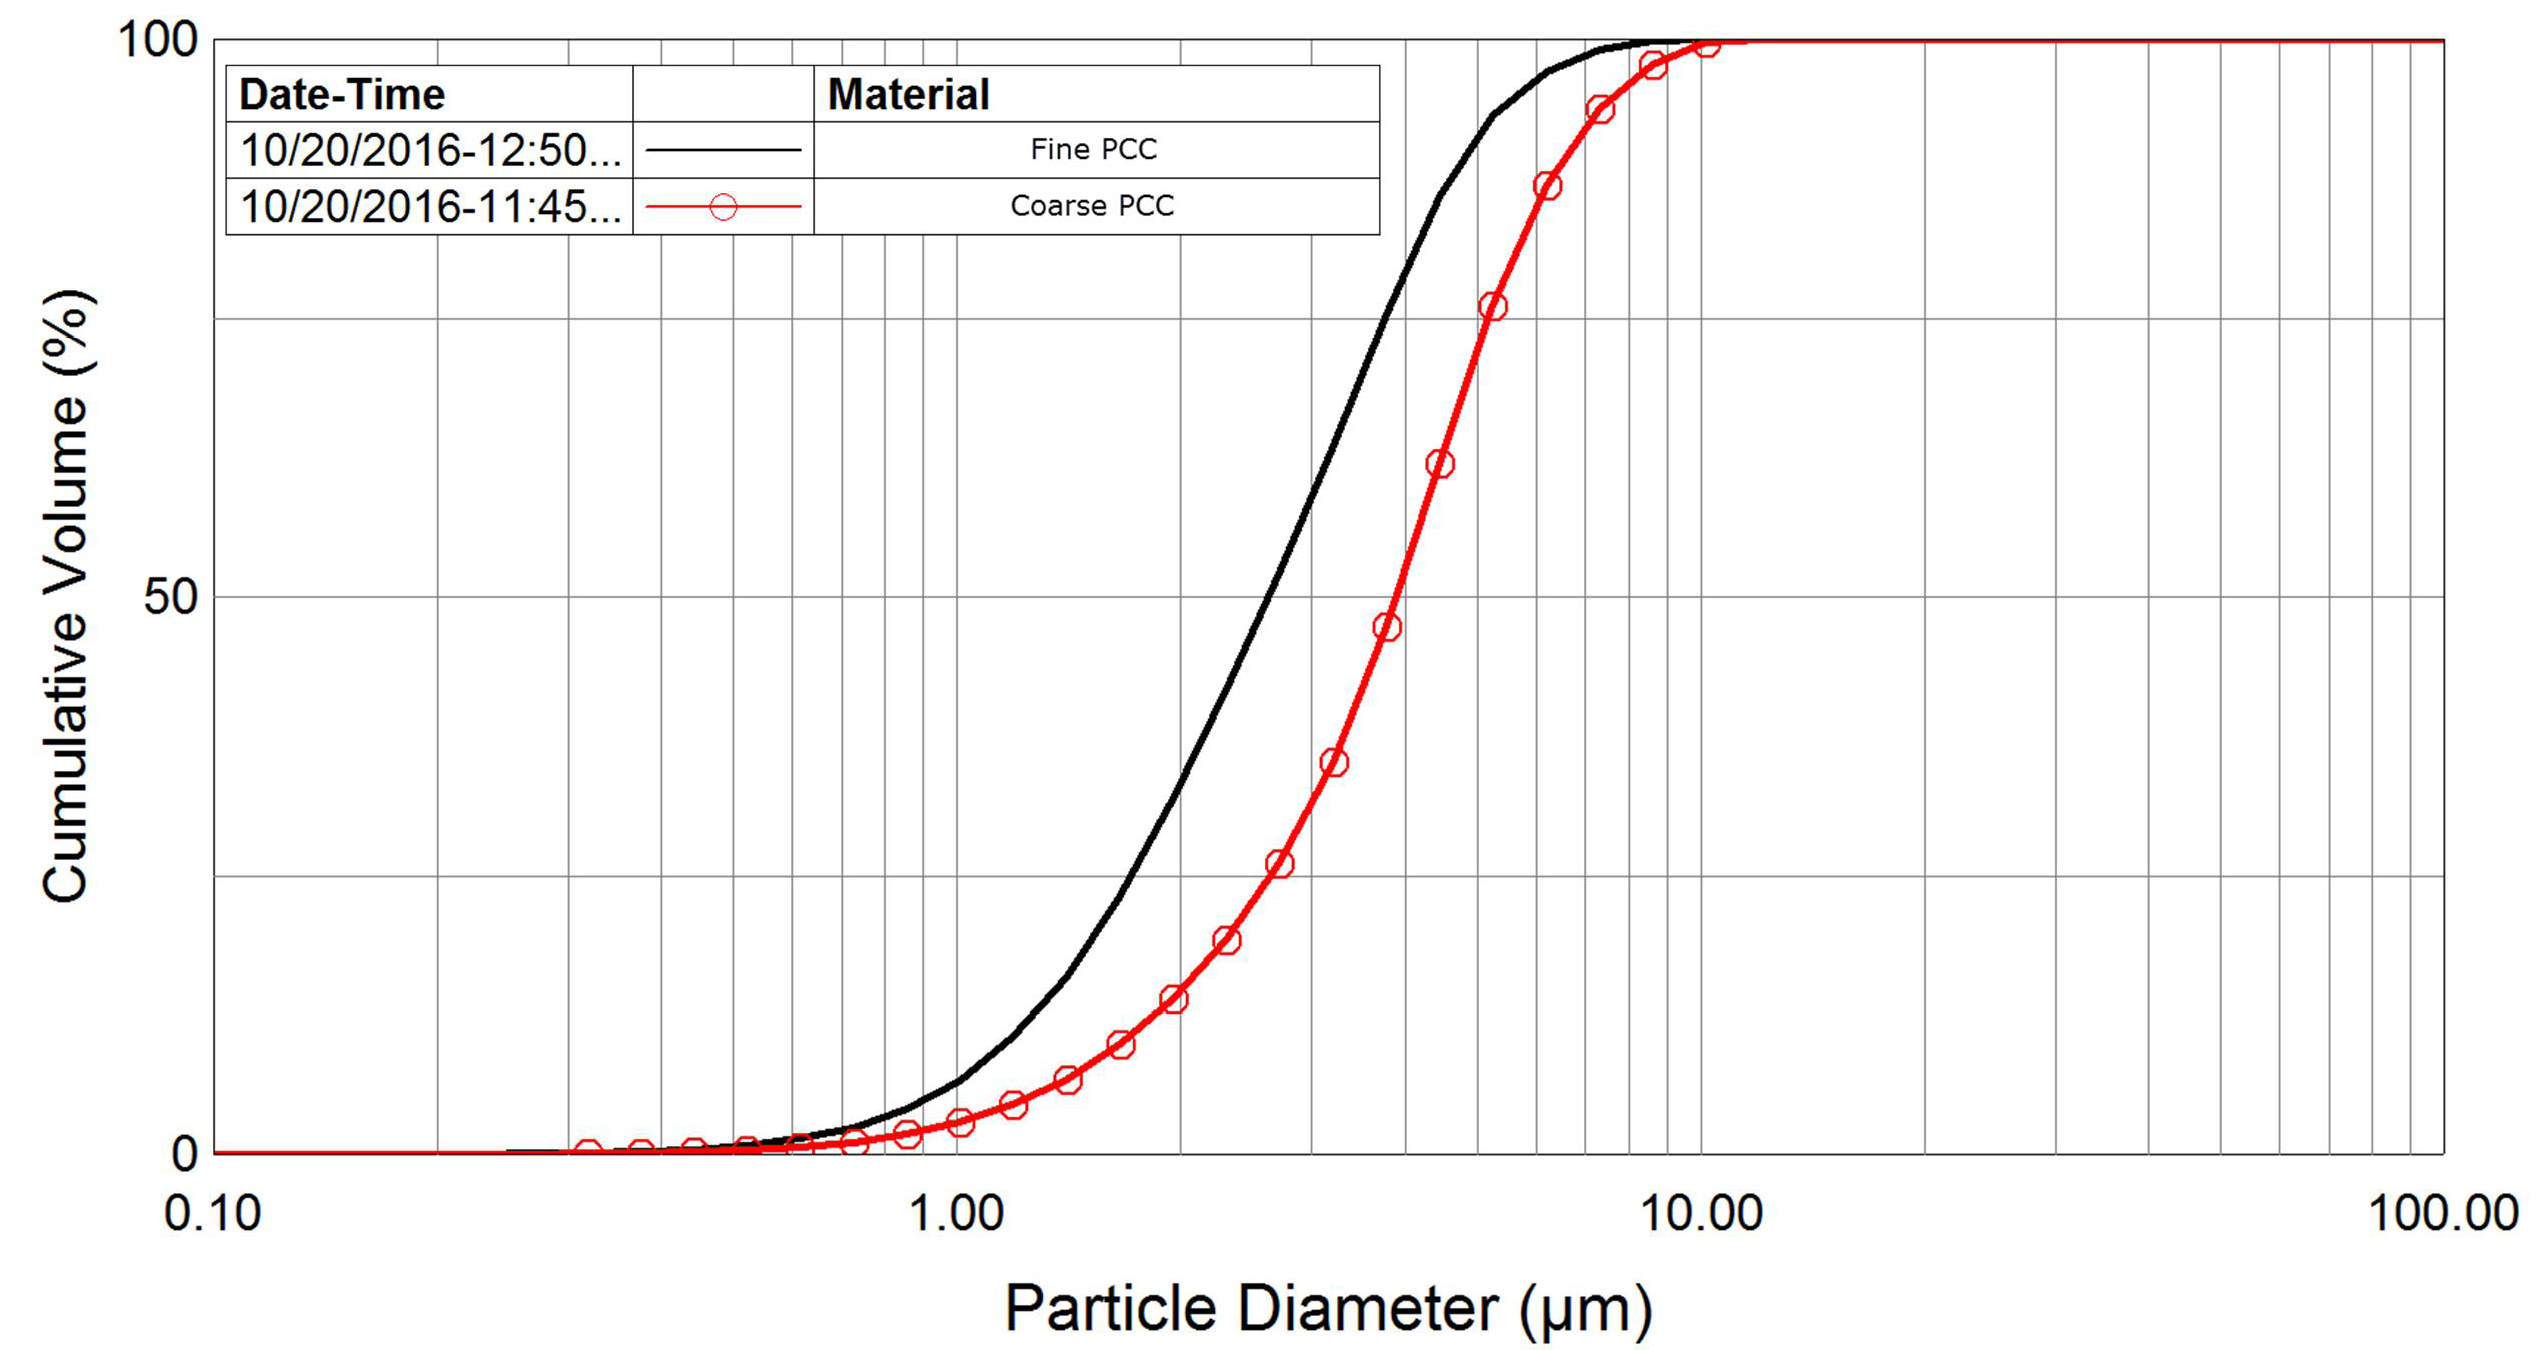
Figure 3 - Cumulative particle size distribution comparison for fine (black) and coarse (red) precipitated calcium carbonate.
The success of switching from traditional off-line SediGraph analysis to continuous on-line laser diffraction measurements can be measured on multiple criteria:
By integrating the Insitec LPS into the precipitated calcium carbonate process, manufacturers can gain the competitive edge necessary to grow alongside an expanding market.
1. https://www.transparencymarketresearch.com/calcium-carbonate-market.html