Efficient dispersion of your sample enables accurate particle sizing. But how can you tell if you are merely dispersing agglomerates or starting to break up or mill your particles? The Hydro Sight accessory for the Mastersizer range shows you all you need to know.
Accurately measuring the particle size distribution of a sample relies on various factors. Foremost amongst these is a reliable, high-precision sizing instrument, and equally as important is the successful dispersion of the sample to its constituent primary particles.
Efficient dispersion of a sample relies on careful selection of the dispersing medium and a range of surfactants and additives. Additionally, the application of ultrasound to physically separate particles can ensure a good dispersion.
Achieving the correct dispersion conditions for your particular sample is a fine balance. The instrument will report a particle size distribution which is inclusive of any agglomerations of particles in the sample, often leading to a skewed reported particle size. Conversely, if dispersion conditions are too harsh, the primary particles may be broken up or ‘milled’. This is equally undesirable as it too is unrepresentative of the sample being analyzed.
Determining the point at which agglomerated particles have been fully dispersed but the primary particles are not being milled is the realm of the particle sizing method development specialist. Traditionally, an aliquot of the sample is observed off-line using microscopy to identify if milling or dispersion is taking place. In this application communication we demonstrate how the Hydro Sight imaging accessory can be used to facilitate this process in-line.
Urea-formaldehyde, a multipurpose resin containing needle-like particles, was prepared for measurement on the Mastersizer 3000 laser diffraction system. The Mastersizer was connected to a Hydro MV wet dispersion accessory with the Hydro Sight attached in-line. Sample was added until the required laser obscuration was reached. At this point, the Hydro Sight analysis was started, alongside the laser diffraction measurement.

|
While the laser diffraction measurement is underway, the Hydro Sight analyses images of the sample passing through the system, examples of which are shown in Figure 1. From these images, the Hydro Sight builds up a size distribution and an elongation distribution of the particles. Data can be captured at any point, saving the current distributions along with a representative image frame. In this example, the results were acquired simultaneously with the laser diffraction measurement.
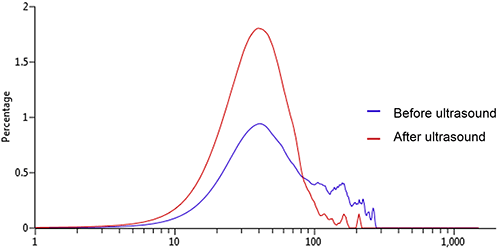
Following the initial measurement, ultrasound was applied to aid sample dispersion. The subsequent Mastersizer particle size distribution measurement, depicted in Figure 2, shows evidence of a reduction in Dv90 coupled with an increase in the level of fines. This result is consistent with dispersion of the sample and elimination of agglomerated particles. However, given the needle-like shape of the particles, it is possible that there has also been some milling.

|
Capturing a result on the Hydro Sight resets the distributions, so that they are representative of the sample following the application of ultrasound. As before, the Hydro Sight result was acquired on completion of the Mastersizer measurement. A comparison of the size distributions generated by the Hydro Sight before and after ultrasound is shown in Figure 2.
|
The distributions measured by the Hydro Sight suggest the same change in size distribution post-ultrasound as determined by the Mastersizer. The real advantage of the Hydro Sight in this application is the shape information which can be elucidated from the images analyzed. As Figure 3 illustrates, the elongation distributions captured over the same image frame sequences reveal an increase in particle elongation following the application of ultrasound, as would be expected when dispersing agglomerated urea-formaldehyde into single particles.

|
The measured increase in particle elongation does not support the theory that ultrasound could be milling the sample; instead it confirms that the process causes the needle-like particles to disperse. Placing the Hydro Sight in-line with the Mastersizer 3000 allows the state of the sample dispersion to be assessed simultaneously with size measurement during the dispersion process, without the need for offline analysis.
In this application communication, use of the Hydro Sight imaging accessory in-line with the Mastersizer 3000 has been demonstrated to assist rapid and simple determination of whether the application of ultrasound results in dispersion or milling of a sample of urea-formaldehyde.
Images captured by the Hydro Sight as the sample circulates through the Mastersizer 3000 system allow basic shape information to be resolved and monitored throughout the dispersion process, complementing the size information provided by the laser diffraction instrument. Consequently, the increase in elongation observed during the application of ultrasound confirms that the needle-like sample is being dispersed rather than milled, thus eliminating the need for off-line microscopic assessment of the sample dispersion.