This note compares the use of three different methods – X-ray diffraction, near infrared spectroscopy and differential scanning calorimetry – for quantifying small amounts of amorphous material in a crystalline matrix, and vice versa.
In this investigation we used alphalactose monohydrate as a model substance. In the pharmaceutical
industry this material is widely employed as a filler and diluent in tablets and capsules, as a carrier substance in dry powder inhalers and as a lyoprotectant during the freeze-drying of proteins.
In this investigation we used alpha-lactose monohydrate as a model substance. In the pharmaceutical industry this material is widely employed as a filler and diluent in tablets and capsules, as a carrier substance in dry powder inhalers and as a lyoprotectant during the freeze-drying of proteins. During the production and processing of alpha-lactose monohydrate in pharmaceutical products the compound undergoes several manufacturing steps that can cause disruption of the crystalline structure, leading to the formation of amorphous regions. The detection and quantification of such regions is an important process control parameter because their presence can have a profound influence on processing behavior and the properties of the finished product.
To ensure complete re-crystallization of any amorphous region present, samples of 100% crystalline alpha-lactose monohydrate were stored at a relative humidity of 65% and 30 °C for one week prior to use. Samples of amorphous lactose were prepared by lyophilization of a saturated lactose solution. Spectra (XRD, NIRS and DSC) were obtained of the pure crystalline and amorphous forms, and of binary mixtures, with an interval of 10% (10-90%) and an interval of 1% (1-9% and 90-100%).
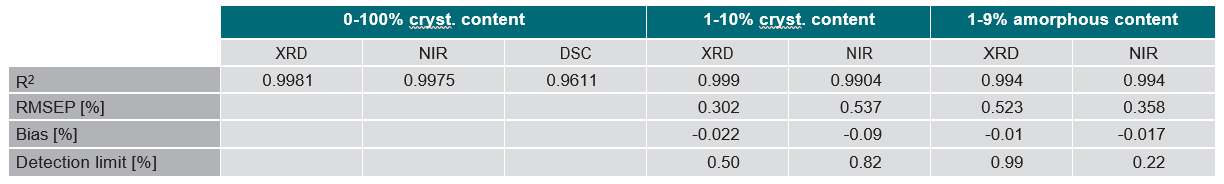
This note compares the use of three different methods – X-ray diffraction (XRD), near-infrared spectroscopy (NIRS) and differential scanning calorimetry (DSC) – for quantifying small amounts of amorphous material in a crystalline matrix, and vice versa. Particular emphasis is placed on comparing the precision, accuracy, detection limit and speed of measurement of the different methods. XRD and NIRS proved to be excellent techniques with low detection limits of amorphous or crystalline material, whereas DSC proved to be too inaccurate for quantification of low crystalline or amorphous amounts of the model substance alpha-lactose monohydrate.
XRD patterns were obtained using a Theta-Theta system with Cu Kα radiation (40 kV, 40 mA) in Bragg-Brentano geometry. The system was equipped with a programmable divergence slit on the incident beam side and PIXcel detector with anti-scatter slit and Ni filter on the diffracted beam side. 0.04 rad Soller slits were used on both sides to limit the axial divergence of the beam.
Measurement conditions were as follows:
a) Mixture 0-100% crystallinity:
0.008 step size, 3 min/measurement, scan range 4-40° 2theta
b) Mixture 0-9% amorphous content:
0.016 step size, 2 min/measurement, scan range 7-45° 2theta
c) Mixture 0-10% crystalline content:
0.008 step size, 6 min/measurement, scan range 12-13° 2theta
Data were evaluated using the HighScore software for phase identification. For the evaluation of samples (a) and (c), the peak area under the reflection at 2theta = 12.4° was used for calibration. For the evaluation of samples (b), the relative intensity between reflections and background (Inet / Iobs) was used.
Reflectance spectra were taken with a Vector 22/N FT NIR spectrometer with fiber optics. The mean spectrum of 32 scans for each sample over a wave number region of 3800-12000 cm-1 was recorded (taking 30 seconds for each measurement).
The regression model for the samples was calculated by partial least squares (PLS) regression after data preprocessing by multiplicative scatter correction and first derivative. In a binary crystalline/ amorphous mixture, the quantification of an increasing amorphous content can most accurately be determined by measuring the reduction of the OH-combination oscillations of the crystal water. Therefore evaluation of the low amorphous content was undertaken using data in the range 5342 – 4865 cm-1.
For the evaluation of samples with low crystalline content (i.e. a large amount of water-free amorphous lactose) a water- independent part of the spectrum, in the range 5992 – 5693 cm-1, was used for calibration.
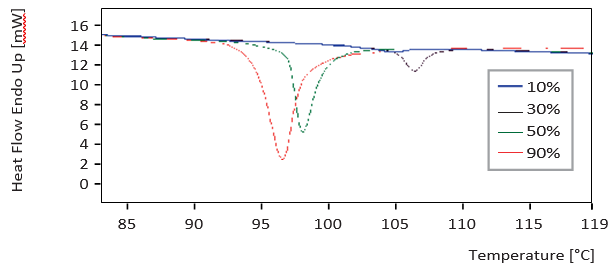
Measurements of crystallization energy were carried out on a Perkin Elmer Pyris 1 Differential Scanning Calorimeter using sealed aluminium pans at a scanning rate of 10°C/min. Each measurement took about 15 minutes. The lack of a pronounced melting peak and glass transition meant that evaluations using the relationship between crystallization and melting peak, or using the glass transition, were not possible.
For the measurements a programmable divergence slit on the incident beam side, and a PIXcel detector with anti-scatter slit and Ni filter on the diffracted beam side, were used. 0.04 rad Soller slits on both sides limited the axial divergence of the beam.
Figures 1 to 3 show the scans that were generated using the different analytical methods on 10%, 30%, 50% and 90% amorphous material for comparison. The calibration curves for an increasing crystalline content (0-100%) at 10% intervals for the three methods are given in Figures 4 to 6. Both XRD and NIRS calibrations showed excellent linearity with a correlation coefficient of better than 0.99. Only the NIR absorption spectrum of the 100% amorphous sample deviated significantly from the calibration line of the other NIR spectra; this was due to the absence of crystal water. The DSC results showed no linear correlation and needed a polynomial fit. Precision and bias with DSC were reduced for amorphous contents higher than 70% (high standard deviation), while for contents lower than 20% the sensitivity decreased. Therefore no further account was taken of DSC for detailed analysis of small amorphous or small crystalline contents.
Figures 7 and 8 show calibration curves for XRD and NIRS using a small amount of crystalline lactose in an amorphous matrix (1-10% crystalline content) at 1% intervals. Figures 9 and 10 show comparable data for a small amount of amorphous lactose in
a crystalline matrix (1-9% amorphous content). Both methods demonstrated impressive detection limits, down to about 0.5% with small amounts of crystalline lactose and less than 1% with small amounts of amorphous lactose. XRD proved more precise than NIRS for small amounts of crystalline lactose while NIRS was more precise than XRD for small amounts of amorphous lactose.
Comparative data are summarized in Table 1.
Figure 1. XRD scans for samples with different amorphous lactose content
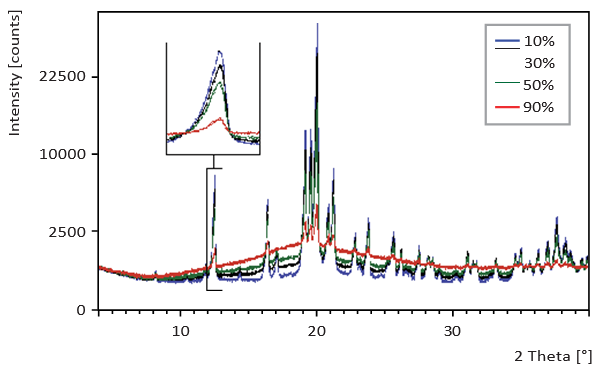
Figure 2. NIR spectra collected on samples with different amorphous lactose content
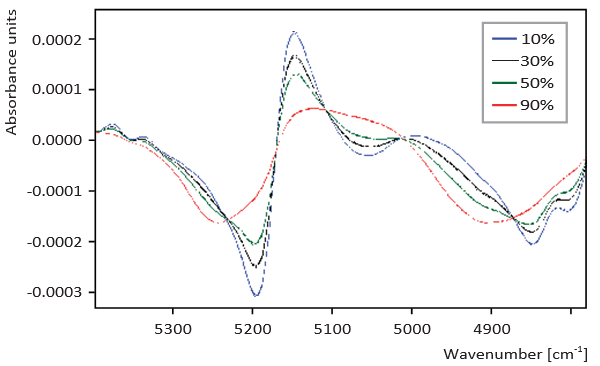
Figure 3. DSC curves from samples with different amorphous lactose content
“The precision of an analytical procedure expresses the closeness of agreement (degree of scatter) between the series of measurements obtained from multiple sampling of the same homogeneous sample under the prescribed conditions. Precision may be considered at three levels: repeatability, intermediate precision and reproducibility. (…)
The precision of an analytical procedure is usually expressed as the variance, standard variation or coefficient of variation of a series of measurements.” In the present document we are referring to the precision as relative standard deviation.
“The accuracy of an analytical procedure expresses the closeness of agreement between the value which is accepted either as a conventional true value or an accepted reference value and the value found. This is sometimes termed trueness.”
Figure 4. XRD calibration curve, 10% intervals
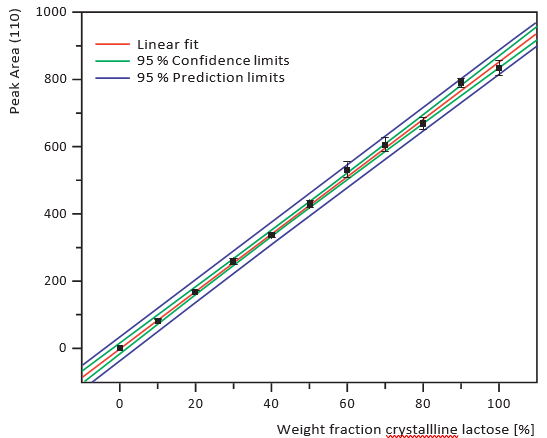
Figure 5. PLS regression of the NIRS data, 10% intervals
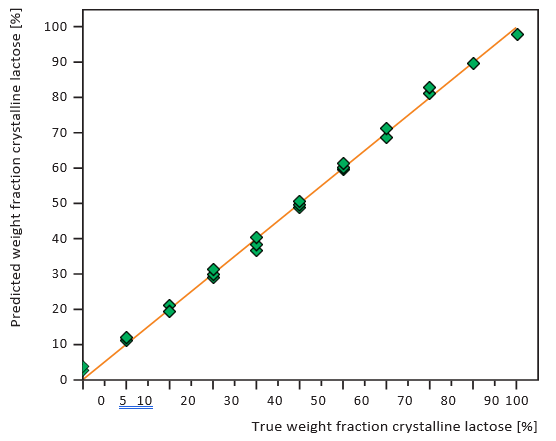
Figure 6. DSC calibration curve, 10% intervals
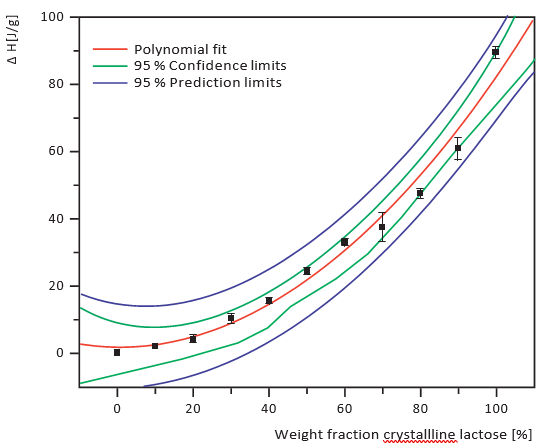
Figure 7. XRD calibration curve of small amounts of crystalline lactose in an amorphous matrix, 1% intervals
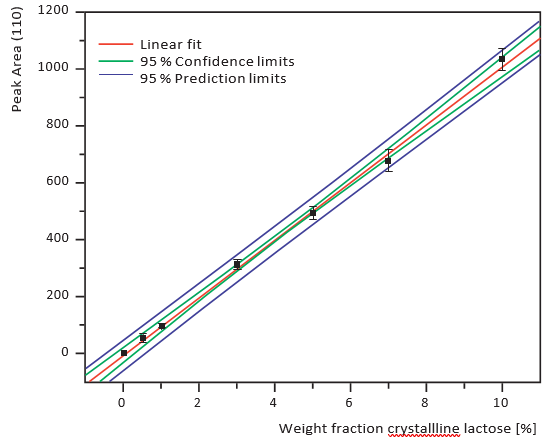
Figure 8. PLS regression of the NIRS data, small amounts of crystalline lactose in an amorphous matrix, 1% intervals
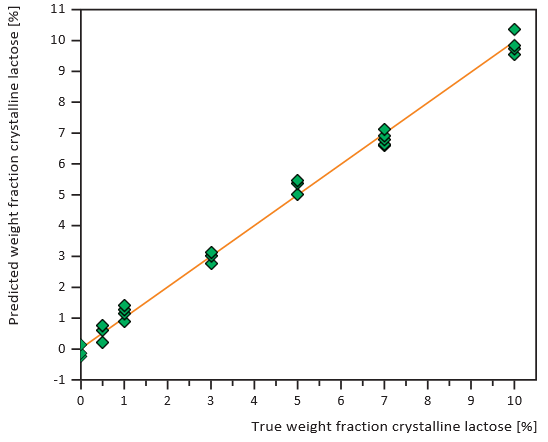
Figure 9. XRD calibration curve of small amounts of amorphous lactose in a crystalline matrix, 1% intervals
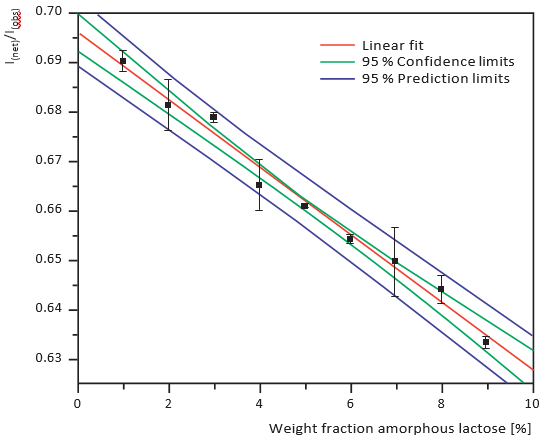
Figure 10. PLS regression of the NIRS data, small amounts of amorphous lactose in a crystalline matrix, 1% intervals
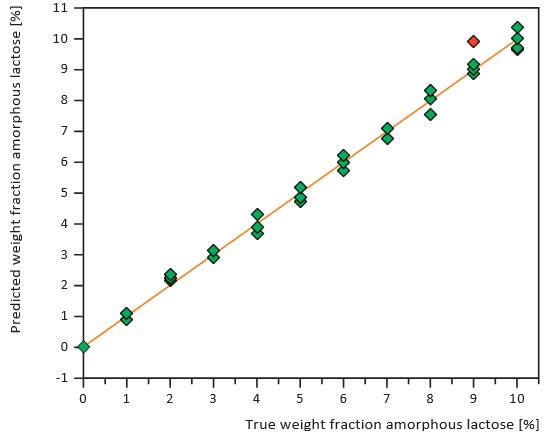
Table 1. Comparative data for XRD, NIRS and DSC as based on description in the ‘definition box’
Measurement of crystallization energy using DSC proved to be too inaccurate to allow quantification of low amounts of amorphous or crystalline lactose. This is probably due to incomplete crystallization of the amorphous regions. Both XRD and NIRS, however, proved to be excellent techniques for determining small amounts of amorphous material in a crystalline matrix, and vice versa. XRD especially demonstrated advantages in the detection and quantification of low crystalline content in an amorphous matrix. XRD is a powerful technique with a capacity for in situ characterization of the whole formulation, correlating physicochemical structure to observed stability and drug release profiles. Because of its high sensitivity for small crystalline content, XRD is the preferred technique for monitoring crystallization processes. Not only does it offer detection of crystallization at extremely low limits, it also allows direct determination of crystallization products.