The quality of metal parts produced by powder-bed additive manufacture is intrinsically bound to the quality of the feedstock material – metal powders. Particle size distribution is a key metric that is used to certify and monitor the quality of metal powders both prior to first use and during powder recycling. Two techniques are typically deployed for this – laser diffraction for the smaller particle size fractions and sieve analysis for the larger particles.
While sieve analysis remains a popular and established sizing technique for larger particles, the addition of a dynamic imaging accessory to your laser diffraction system can allow you to measure the complete size distribution in a single test.
The technical and commercial opportunities of additive manufacture for metal part production are numerous. These include, but are not limited to, increased design freedom, weight reduction and supply chain security. However, a commercial challenge exists in the form of powder recycling. The powder is an expensive commodity and with 80-95% being unused in any given build cycle, the process can be wasteful. Hence, for additive manufacture to be a commercially viable option, the powder needs to be recycled. However, powder degrades with use, which eventually leads to failures in part quality. This is often due to a reduction in material density where the powder is fused to make the part and is typically a result of deviations in powder flow and packing. These deviations can be subtle, but the consequences of part failures in the field can be catastrophic. Hence, the paradox of using such high precision engineering is its susceptibility to minor deviations in the feedstock.
To control this, scientists and engineers deploy a variety of metrics to monitor powder quality. Particle size distribution is one of these and laser diffraction and sieve analysis are two commonly used tools to measure it. With fast analysis times and a wide dynamic range, laser diffraction is the natural choice for most groups using additive manufacture technology. Indeed, it is a technique recommended by standards authorities for quality control of received materials1,2,3.
Described as an ensemble technique, laser diffraction reports values that are descriptive of the entire sample population. However, it is less sensitive to irregular particle shape and individual outliers, such as oversized particles. For this reason, many groups also employ sieve analysis to evaluate the large particle content. However, this technique lacks sensitivity at the fine fraction of the distribution. So, a compromise is often found whereby laser diffraction is used to qualify the fine fraction and sieve analysis the coarse fraction.
Here, we present a potential solution to this problem by means of the Hydro Insight dynamic imaging accessory. Sitting alongside the Mastersizer 3000 laser diffraction system, the Hydro Insight provides real-time images of your metal powder dispersions and individual particles, as well as quantitative data on particle size and shape that can be readily correlated with sieve analysis.
In this configuration, particle size distribution of metal powder is measured in an aqueous suspension with the industry standard technique of laser diffraction using the Mastersizer 3000 optical bench and the Hydro MV dispersion unit. The Hydro Insight dynamic imaging accessory is fitted with the standard magnification lens (x7.2), in-line with the optical bench and dispersion unit. This gives orthogonal particle size data and can detect oversize particles and irregularities in particle shape.
Particle size distributions are reported here as volume-weighted to show similarity between the laser diffraction and dynamic imaging techniques. Further, sieve correlations are reported based on equivalent circular area (ECA) diameter and bounded rectangle (BR) width to show the impact of using circular models and the second largest dimension when correlating to sieve data.
Figure 1 shows the particle size distribution of a nickel-based alloy for additive manufacture, using the Mastersizer 3000 laser diffraction system. The main mode is centered around 30-40 μm, but there is an additional mode of oversize particles, centered around 200 μm. Sieve analysis would confirm the presence of this mode, but at the expense of more time and more material.
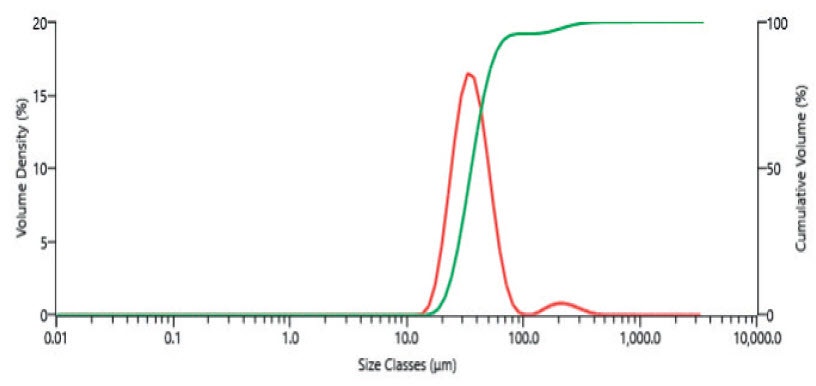
Figure 1. Particle size distribution by Laser Diffraction (red) and corresponding cumulative undersize chart (green)
Alternatively, the same sample can be measured simultaneously with the Hydro Insight imaging accessory to yield a similar data output (Figure 2) and confirmatory results (Table 1). Most importantly, is clear evidence of oversize particles and what they look like (Figure 3). Interestingly, there appears to be a mix of highly spherical particles, satellited particles and highly irregular particles. Highly spherical is the desired shape for maximizing flowability and packing density thus ensuring a consistent material density on the build platform. As such, the more expensive powders tend to have a higher fraction of highly spherical particles.
| Dv10 | Dv50 | Dv90 | |
|---|---|---|---|
| Mastersizer 3000 | 23 | 36 | 59 |
| Hydro insight | 29 | 40 | 109 |
Table 1. Distribution quantiles at the 10th, 50th and 90th percentiles from both systems measured in series.
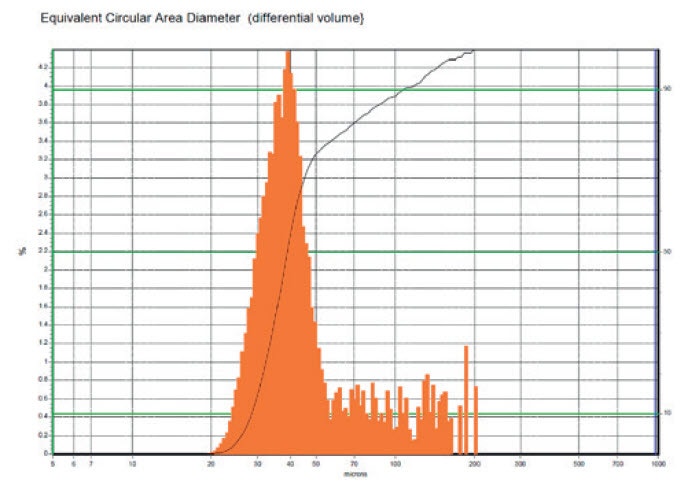
Figure 2. Particle size distribution by Dynamic Imaging (orange) and corresponding cumulative undersize chart (black curve).
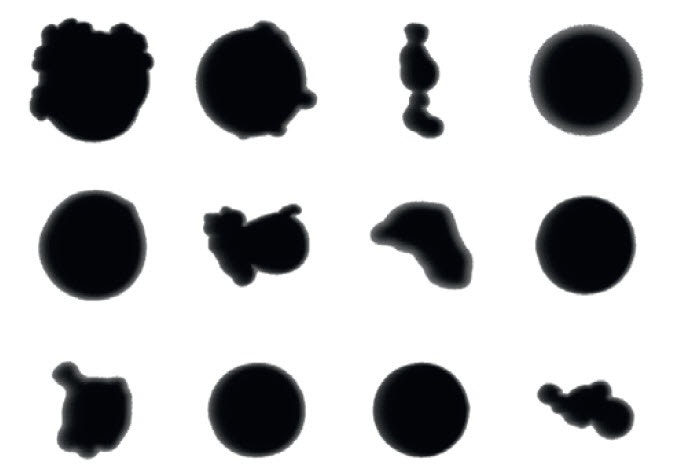
Figure 3. Example images of the oversize particles.
It is proposed here that this combination of laser diffraction with an imaging accessory could replace the need for sieve analysis in quality control or enable correlation with sieve data. The Hydro Insight accessory has a sieve correlation function that shows the expected fractions based on a given particle dimension. Typically, the BR width is used when dealing with non-spherical particles. Figure 4 shows the histograms and undersize charts of the expected sieve fractions, based on ECA diameter and BR width. Due to the orientation effects of irregular shaped particles passing through the sieve apertures, the BR width tends to give a more accurate correlation to sieve analysis. Furthermore, substantial differences between these dimensions indicates significant irregularity or elongation to the particles. Table 2 contains the sieve fraction percentages and shows differences of up to 7.8% between them. This confirms that a sizeable fraction of particles were non-spherical and therefore suboptimal for certain additive manufacturing techniques.
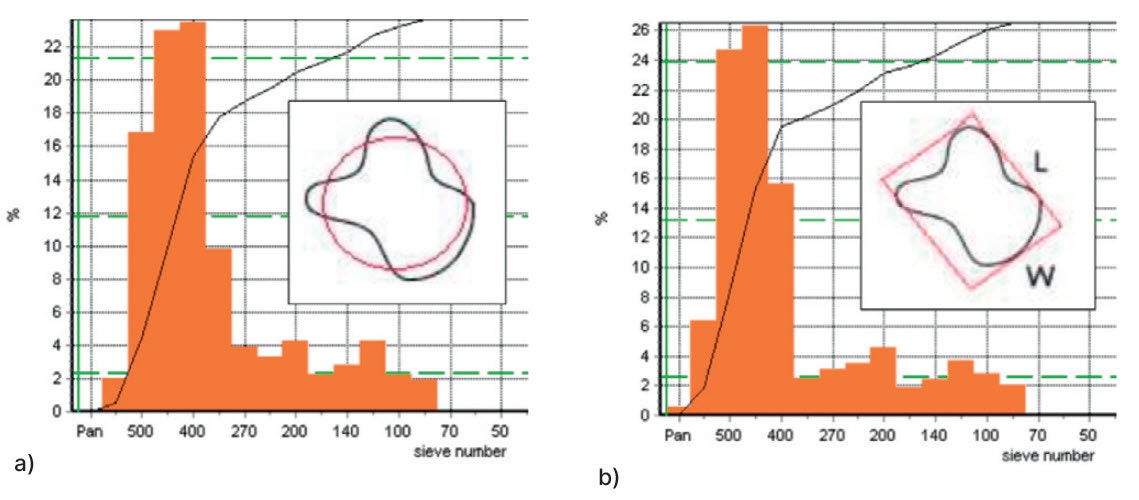
Figure 4. Sieve fraction correlations from a) ECA diameter and b) BR width.
| Aperture size (μm) | ECA diameter % | BR width % | Differences |
|---|---|---|---|
| <20 | 0.02 | 0.543 | -0.523 |
| 20 | 2.017 | 6.378 | -4.361 |
| 25 | 16.818 | 24.692 | -7.874 |
| 32 | 22.987 | 26.327 | -3.34 |
| 38 | 23.495 | 15.666 | 7.829 |
| 45 | 9.817 | 2.496 | 7.321 |
| 53 | 3.913 | 3.071 | 0.842 |
| 63 | 3.265 | 3.497 | -0.232 |
| 73 | 4.254 | 4.585 | -0.331 |
| 90 | 2.257 | 1.825 | 0.432 |
| 103 | 2.747 | 2.450 | 0.297 |
| 125 | 4.217 | 3.688 | 0.529 |
| 150 | 2.280 | 2.772 | -0.492 |
| 180 | 1.193 | 2.011 | -0.098 |
Table 2. Sieve correlations based on Equivalent Circular Area (ECA) diameter and Bounded rectangle (BR) width.
Here, we have demonstrated that the combination of laser diffraction with a dynamic imaging accessory can provide two orthogonal tests of particle size distribution from one method. More importantly, is the greater sensitivity to oversize particles – a key quality metric for metal powders. In addition, the sieve correlation function can bridge the gap between these techniques to either confirm results or provide a means for root cause analysis.