This datasheet investigates the capabilities of the Epsilon 4, a benchstop energy dispersive X-ray fluorescence spectrometer as a tool for analyzing lead in wheat noodles. The simple sample preparation along with quick measurements of elements, make the XRF technique an interesting analytical method for the food industry. It allows analysis close to production lines.
The Codex Alimentarius requires a maximum level of lead to be less than 0.2 mg/kg in cereal grains (Codex Standard 193-1995).
The Codex Alimentarius requires a maximum level of lead to be less than 0.2 mg/kg in cereal grains (Codex Standard 193-1995). This application note investigates the capabilities of the Epsilon 4, a benchtop energy dispersive X-ray fluorescence spectrometer as a tool for analyzing lead in wheat noodles. The simple sample preparation along with quick measurements of elements, make the XRF technique an interesting analytical method for the food industry. It allows analysis close to production lines.
Measurements were performed using Malvern Panalytical Epsilon 4 EDXRF spectrometers, equipped with a 10W, 50 kV silver anode X-ray tube, 6 beam filters, a helium purge facility, a high-resolution SDD silicon drift detector, a sample spinner and a 10-position removable sample changer.
Noodles were purchased from a local grocery store and ground to a fine powder using a ball mill (Retsch MM400). Known amounts of lead were spiked into 5 g samples of the fine noodle powder to create the calibration samples. The samples were placed into loose powder sample cups with a 3.6 µm thick Mylar foil.
Five calibration samples were used to set up the calibration. The measurement condition used to measure lead is shown in Table 1. The analyses were performed in air atmosphere and the total measurement time was 15 minutes per sample. The intensities for lead were measured with a region of interest (ROI) calculation using intensities from the Lα and Lβ lines. The spectrum for one of the calibration samples is shown in Figure 1.
Table 1. Measurement conditions
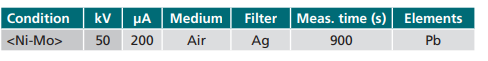
Figure 1. Zoomed-in spectrum of lead in noodles obtained using the condition <Ni-Mo>
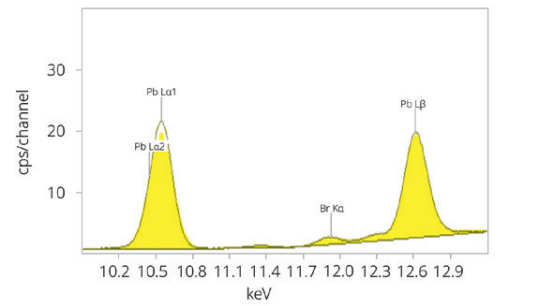
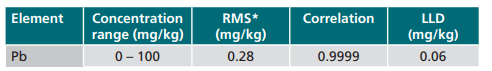
Figure 2 shows the calibration plot for lead in noodles, applying the condition listed in Table 1. The calibration plot demonstrates a good correlation between the chemical concentrations and the measured intensities. Table 2 summarizes the calibration data for the noodle samples.
Figure 2. Calibration graph for lead in noodles
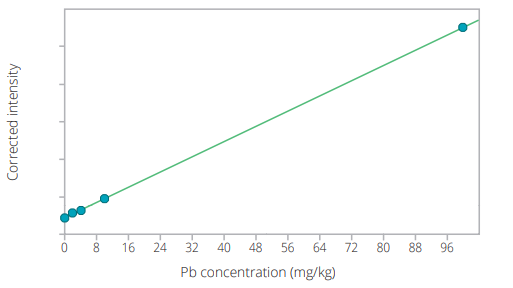
Table 2. Calibration details
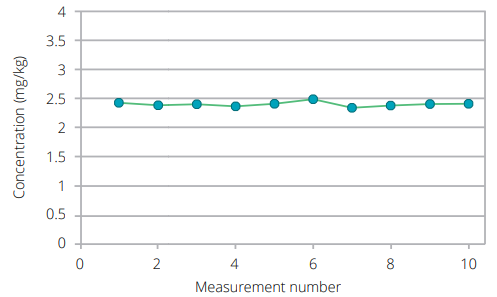
To test the repeatability, the 2 mg/kg calibration sample was measured as an unknown, ten times consecutively. The average concentration, RMS (1 sigma standard deviation) and the relative RMS of the repeat measurements for lead are presented in Table 3. The individual results for the ten measurements are displayed graphically in Figure 3. The results demonstrate excellent precision.
Table 3. Results of the repeatability test of lead in noodles
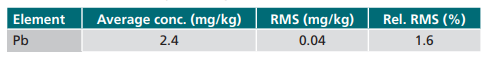
Figure 3. Graphical representation of the repeatability results
The data presented in this application note clearly demonstrate that the Epsilon 4 EDXRF spectrometer is well suited for the analysis of lead in wheat noodles with detection limits meeting the limits required by the Codex Alimentarius, with analysis time of 15 minutes.
The repeatability results illustrate the stability and robustness of the Epsilon 4. The combination of excellent detector resolution, high sensitivity and powerful software contribute to the accuracy and precision of the results.