
Soil contains a wide variety of compounds and elements. This can range from nutrients like sulphates and phosphates to toxic elements like arsenic or cadmium. The destination of a location can be determined based on the elemental composition of soil. This datasheet demonstrates that the Epsilon 4, a benchtop energy dispersive X-ray fluorescence spectrometer (EDXRF), can analyze major, minor and trace elements in soils and sediments, prepared as pressed powders. In this datasheet an application method is set up for 36 compounds and trace metals present in soils.
Measurements were performed using a Malvern Panalytical Epsilon 4 EDXRF spectrometer, equipped with a 50 kV silver (Ag) anode X-ray tube, 6 software-selectable filters, a helium purge facility to improve the light element performance, a high-resolution SDD30 silicon drift detector, a sample spinner, and a 10-position removable sample tray for unattended batch analysis.
Twenty-six soil and sediment certified reference standards were used to create the application and included the GSS- and GSD- series of geochemical reference materials (Institute of Geophysical and Geochemical Prospecting, PRC) together with NIST SRM 2709, 2710 and 2711 (National Institute of Standards and Technology, USA). The standards were analyzed in the form of pressed powder pellets. The standards and samples were oven dried and then pulverized in a planetary ball mill together with 20% wax/styrene additive. The additive acts as a binder and a grinding agent, resulting in a uniform grain-size of smaller than 40 µm. Twelve grams of the mixture was pressed into pellets using a hydraulic press operated at 20 tons pressure.
Six different measurement conditions were used, each one optimized to excite a particular group of elements (Table 1). The total measurement time was 25 minutes per sample.
| Compounds | kV | uA | Medium | Filter | Meas. time (s) |
|---|---|---|---|---|---|
| NaO2, MgO, Al2O3, SiO2 | 5 | 2000 | Helium | <none> | 180 |
| P2O5, SO3 | 9 | 1100 | Helium | Ti | 180 |
| K2O, CaO2, TiO2, V, Ce | 12 | 1000 | Helium | Al-thin | 180 |
| Cr, MnO, Fe2O3, Co | 20 | 600 | Air | Al-thick | 180 |
| Ni, Cu, Ga, As, Br, Rb, Sr, Y, Zr Nb W, Pb, Bi, Th, U, Zn | 50 | 300 | Air | Ag | 180 |
| Mo, Cd, Sn, Sb, Ba | 50 | 300 | Air | Cu-thick | 600 |
Figures 1, 2 and 3 show the resulting calibration graphs for MgO, As and Cd in the soil and sediment standards, respectively. The graphs show very good correlation between the certified concentrations and the measured intensities. Detailed calibration results for all analyzed compounds and trace elements are listed in Table 2. The RMS (Root Mean Square) value is equivalent to 1 sigma standard deviation.
| Compounds | Concentration range | RMS* | Correlation Coefficient |
|---|---|---|---|
| Al2O3 (wt%) | 2.840 - 29.260 | 0.558 | 0.9921 |
| As (ppm) | 2 - 626 | 3.2 | 0.9998 |
| Ba (ppm) | 42 - 1210 | 24.2 | 0.9968 |
| Bi (ppm) | 1.0 – 50.0 | 1.4 | 0.9980 |
| Br (ppm) | 1.5 – 7.2 | 0.4 | 0.9824 |
| CaO (wt%) | 0.095 - 8.270 | 0.200 | 0.9968 |
| Cd (ppm) | 0.1 - 41.7 | 05 | 0.9989 |
| Ce (ppm) | 38.0 - 400.0 | 17.7 | 0.9793 |
| Co (ppm) | 2.6 – 28.0 | 1.83 | 0.9704 |
| Cr (ppm) | –7.6 -370 | 12.4 | 0.9897 |
| Cu (ppm) | 4.1 - 2950 | 10.9 | 0.9999 |
| Fe2O3 (wt%) | 1.460 - 18.760 | 0.215 | 0.9970 |
| Ga (ppm) | 6.4 – 39.3 | 5.1 | 0.7813 |
| K2O (wt%) | 0.125 - 5.190 | 0.063 | 0.9984 |
| MgO (wt%) | 0.120 - 3.400 | 0.097 | 0.9961 |
| MnO (wt%) | 0.028 - 1.300 | 0.005 | 0.9998 |
| Mo (ppm) | 0.3 - 92 | 0.3 | 0.9998 |
| Na2O (wt%) | 0.040 - 3.500 | 0.193 | 0.9860 |
| Nb (ppm) | 6.8 - 95 | 1.5 | 0.9978 |
| Ni (ppm) | 2.7 - 276 | 3.8 | 0.9978 |
| P2O5 (wt%) | 0.030 - 0.340 | 0.010 | 0.9900 |
| Pb (ppm)
| 13 - 5532 | 7.82 | 0.9999 |
| Rb (ppm)
| 9.2 - 470 | 4.1 | 0.9993 |
| Sb (ppm)
| 0.2 - 60.0 | 2.4 | 0.9881 |
| SiO2 (wt%) | 32.690 - 88.890 | 2.651 | 0.9761 |
| Sn (ppm) | 1.4 – 3.7 | 4.3 | 0.9986 |
| SO3 (wt%) | 0.023 - 0.600 | 0.030 | 0.9724 |
| Sr (ppm) | 24.4 – 525.0 | 5.5 | 0.9991 |
| Th (ppm) | 5.0 – 70.0 | 2.7 | 0.9793 |
| TiO2 (wt%) | 0.210 – 3.360 | 0.021 | 0.9978 |
| U (ppm) | 5 - 70 | 6.4 | 0.872 |
| V (ppm) | 16.5 - 247 | 4.1 | 0.9972 |
| W (ppm) | 0.52 - 126 | 4.0 | 0.9935 |
| Y (ppm) | 8.3 – 67 | 1.6 | 0.9900 |
| Zn (ppm) | 16 - 6952 | 11.2 | 0.9999 |
| Zr (ppm) | 70 - 250 | 15.1 | 0.9920 |
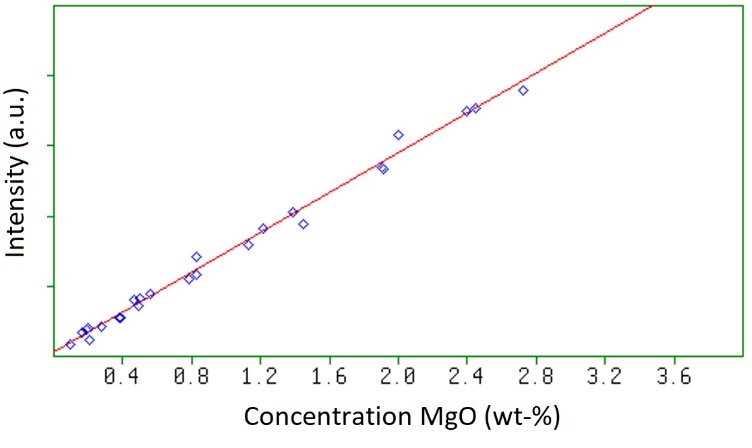
Figure 1. Calibration graph for MgO in soils and sediments
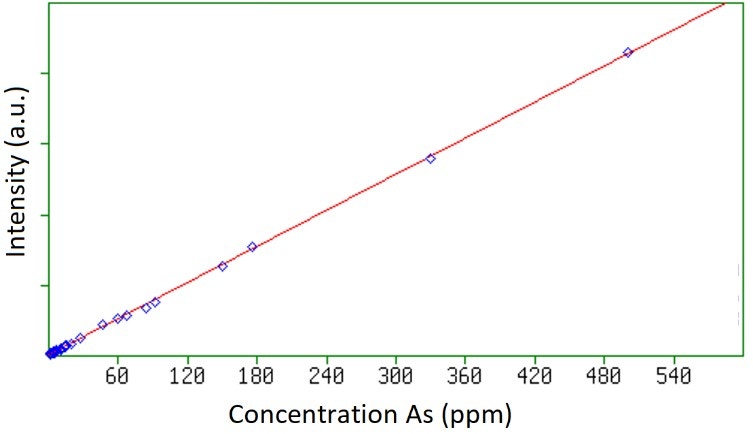
Figure 2. Calibration graph for As in soils and sediments
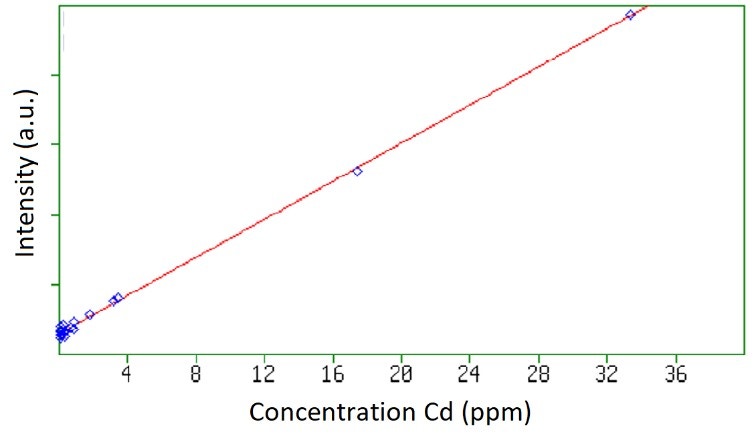
Figure 3. Calibration graph for Cd in soils and sediments
The accuracy and instrument precision was tested by measuring 2 sediment samples, CRM GSS-5 and CRM GSS-8, 20 times consecutively. The certified and average measured concentrations, RMS and relative RMS values are presented in Table 3, demonstrating excellent accuracy and precision. The results show accurate results at low concentration as well in the complex samples with many line overlaps. Example is the capability to measure Cobalt at low levels in the presence of high Fe2O3.
| Compounds | Certified conc. | Average conc. | RMS | Rel. RMS (%) |
|---|---|---|---|---|
| Al2O3 (wt%) | 21.58 | 20.80 | 0.03 | 0.2 |
| As (ppm) | 412 | 404 | 0.7 | 0.2 |
| Ba (ppm) | 296 | 314 | 1.5 | 0.5 |
| Bi (ppm) | 41 | 38 | 0.2 | 0.6 |
| Br (ppm) | 1.8 | 2.2 | 0.1 | 3.0 |
| CaO (wt%) | 0.095 | 0.100 | 0.001 | 0.4 |
| Cd (ppm) | 0.45 | < LLD | n.a. | n.a. |
| Ce (ppm) | 91 | 95 | 7.2 | 7.5 |
| Co (ppm) | 12.3 | 21 | 0.3 | 1.3 |
| Cr (ppm) | 118 | 155 | 1.046 | 0.7 |
| Cu (ppm) | 144 | 130 | 0.6 | 0.4 |
| Fe2O3 (wt%) | 12.62 | 12.62 | 0.008 | 0.1 |
| Ga (ppm) | 31.7 | 27 | 0.2 | 0.6 |
| K2O (wt%) | 1.5 | 1.523 | 0.001 | 0.1 |
| MgO (wt%) | 0.61 | 0.570 | 0.003 | 0.6 |
| MnO (wt%) | 0.18 | 0.174 | 0.001 | 0.1 |
| Mo (ppm) | 4.6 | 4.7 | 0.1 | 2.0 |
| Na2O (wt%) | 0.122 | 0.135 | 0.008 | 6.1 |
| Nb (ppm) | 22.6 | 19.3 | 0.1 | 0.5 |
| Ni (ppm) | 40 | 39 | 0.6 | 1.6 |
| P2O5 (wt%) | 0.09 | 0.07 | 0.008 | 11.7 |
| Pb (ppm) | 552 | 552 | 0.7 | 0.1 |
| Rb (ppm) | 117 | 111 | 0.2 | 0.2 |
| Sb (ppm) | 35.4 | 38.0 | 0.3 | 0.9 |
| SiO2 (wt%) | 52.57 | 50.19 | 0.035 | 0.1 |
| Sn (ppm) | 17.7 | 23.4 | 0.4 | 1.5 |
| SO3 (wt%) | 0.10 | 0.062 | 0.04 | 5.9 |
| Sr (ppm) | 41.5 | 40.7 | ;0.2 | 0.4 |
| Th (ppm) | 22.7 | 26.3 | 0.2 | 0.8 |
| TiO2 (ppm) | 6295 | 6567 | 5.6 | 0.1 |
| U (ppm) | 6.5 | 22 | 0.5 | 2.5 |
| V (ppm) | 166 | 165 | 1.5 | 0.9 |
| W (ppm) | 33.5 | 26.6 | 0.5 | 1.9 |
| Y (ppm) | 21 | 22 | 0.1 | 0.6 |
| Zn (ppm) | 494 | 489 | 0.9 | 0.2 |
| Zr (ppm) | 272 | 274 | 0.3 | 0.1 |
| Compounds | Certified conc. | Average conc. | RMS | Rel. RMS (%) |
|---|---|---|---|---|
| Al2O3 (wt%) | 11.92 | 12.10 | 0.02 | 0.2 |
| As (ppm) | 12.7 | 12.6 | 0.2 | 1.3 |
| Ba (ppm) | 480 | 499 | 2.0 | 0.4 |
| Bi (ppm) | 0.3 | < LLD | n.a. | n.a. |
| Br (ppm) | 2.6 | 2.6 | 0.1 | 1.6 |
| CaO (wt%) | 8.27 | 8.30 | 0.01 | 0.1 |
| Cd (ppm) | 0.13 | < LLD | n.a. | n.a. |
| Ce (ppm) | 66 | 61 | 6.0 | 9.8 |
| Co (ppm) | 12.7 | 12.2 | 0.1 | 0.9 |
| Cr (ppm) | 68 | 72 | 0.8 | 1.1 |
| Cu (ppm) | 24.3 | 22.0 | 0.3 | 1.5 |
| Fe2O3 (wt%) | 4.48 | 4.35 | 0.01 | 0.1 |
| Ga (ppm) | 14.8 | 16.9 | 0.2 | 0.9 |
| K2O (wt%) | 2.42 | 2.35 | 0.01 | 0.1 |
| MgO (wt%) | 2.38 | 2.28 | 0.01 | 0.2 |
| MnO (wt%) | 0.08 | 0.08 | 0.001 | 0.2 |
| Mo (ppm) | 1.16 | 1.1 | 0.01 | 7.7 |
| Na2O (wt%) | 1.72 | 1.33 | 0.02 | 1.7 |
| Nb (ppm) | 15 | 14 | 0.01 | 0.8 |
| Ni (ppm) | 31.5 | 31.1 | 0.4 | 1.4 |
| P2O5 (wt%) | 0.18 | 0.18 | 0.01 | 1.2 |
| Pb (ppm) | 21 | 19 | 0.2 | 1.1 |
| Rb (ppm) | 96 | 95 | 0.01 | 0.1 |
| Sb (ppm) | 1.04 | 1.1 | 0.4 | 33.5 |
| SiO2 (wt%) | 58.61 | 54.8 | 0.04 | 0.1 |
| Sn (ppm) | 2.8 | 2.0 | 0.2 | 12.8 |
| SO3 (wt%) | 0.03 | 0.05 | 0.002 | 3.8 |
| Sr (ppm) | 236 | 227 | 0.2 | 0.1 |
| Th (ppm) | 11.8 | 11.7 | 0.1 | 0.0 |
| TiO2 (ppm) | 3836 | 3625 | 4.2 | 0.1 |
| U (ppm) | 2.7 | 11.6 | 0.4 | 3.8 |
| V (ppm) | 81.4 | 83.1 | 1.3 | 1.6 |
| W (ppm) | 1.7 | 1.9 | 0.3 | 13.7 |
| Y (ppm) | 26 | 25 | 0.1 | 0.3 |
| Zn (ppm) | 68 | 60 | 0.3 | 0.5 |
| Zr (ppm) | 229 | 228 | 0.5 | 0.2 |
The results clearly demonstrate the capability of Epsilon 4 for the analysis of 36 compounds and trace elements in soils and sediments. One measurement will give a full overview what the composition is. The high-resolution and outstanding sensitivity of the SDD30 silicon drift detector combined with powerful software deconvolution algorithms in the Epsilon 4 make it possible to quantify complex soil samples with a high number of compounds and trace elements in an accurate and precise way.