
Dynamic light scattering (DLS) is a technique that is widely used to measure dispersed particle size (specifically the hydrodynamic diameter) via direct measurement of the translational diffusion coefficient within the continuous phase. By utilizing the superior accuracy and resolution of multi-angle dynamic light scattering (MADLS®), it is now possible to determine the absolute particle concentration distribution using the Zetasizer Ultra. This provides the user with a fast assessment of the concentration of each population of particles present within their dispersion. Particle concentration measurements are achieved by recording the time averaged photon count-rate scattered by the sample to perform a transformation of the size distribution to derive the absolute number of particles present. In this technical note we describe the method and calculations used to determine particle concentration.
Dynamic light scattering (DLS) is a technique that is widely used to measure dispersed particle size (specifically the hydrodynamic diameter) via direct measurement of the translational diffusion coefficient within the continuous phase.
By utilizing the superior accuracy and resolution of multi-angle dynamic light scattering (MADLS®), it is now possible to determine the absolute particle concentration distribution using the Zetasizer Ultra. This provides the user with a fast assessment of the concentration of each population of particles present within their dispersion. Particle concentration measurements are achieved by recording the time averaged photon count-rate scattered by the sample to perform a transformation of the size distribution to derive the absolute number of particles present. Knowledge of the optical properties of the material and dispersant are required.
The method of performing this calculation is detailed below.
The size distribution produced by MADLS applies an array of discrete size classes logarithmically spaced across the measurable size range to represent the distribution of particle sizes within the sample. An example of such a particle size distribution is given in Figure 1. Each particle contributes to the result by an amount proportional to the intensity of light that it scatters. The scattered intensity is a function of particle size, d. As such, the native DLS-derived particle size distribution is termed an intensity-weighted particle size distribution, x(d).
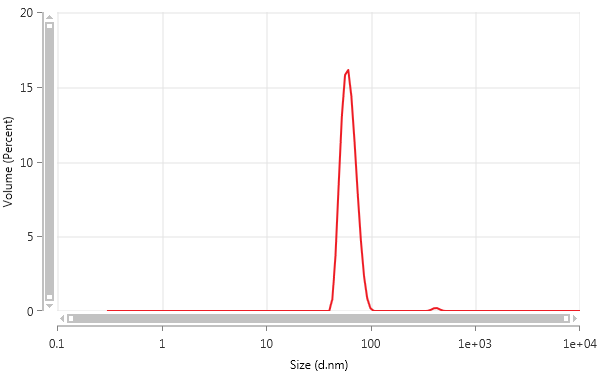
Figure 1: Volume-weighted particle size distribution
The intensity-weighted particle size distribution is related to the absolute particle concentration distribution, ρ(d), i.e. the number of particles per unit volume per size class, according to equation (1).

Where dCsca/dΩ(d) is the size dependent differential scattering cross-section of the particles, i.e. the fraction of photons scattered into a unit solid angle as a function of scattering angle [1]; Ipar is the derived photon count rate due to particle scattering; Itol is the derived photon count rate scattered by toluene – used as a reference liquid; and Rtol is the Rayleigh ratio of toluene. The differential scattering cross-section is calculated using Mie theory and requires knowledge of the material and dispersant refractive index, the instrument laser wavelength and scattering angle etc. To satisfy most sample types, and to simplify the calculation, an assumption is made that the particles scatter according to a hard sphere model. The Rayleigh ratio is the differential scattering cross-section per unit volume which for a material such as toluene is independent of angle (it scatters isotropically) and is documented in the literature.
The left-hand side of (1), ρ(d).(dCsca)/dΩ(d), can be interpreted as the total light intensity scattered by each particle size class. On the right-hand side the same is true, but instead the detected photon count rate is normalized by the instrument detection efficiency: the detected count rate per unit volume total scattered intensity for a toluene reference scatterer: Itol/Rtol.
The particle concentration measurement process is fully automated inside the Zetasizer Ultra and is as follows;
It is important that the size of the material is determined as accurately as possible to minimize propagation of errors into the calculation of the differential scattering cross-section. Additional error minimization is attained through precise knowledge of the dispersant viscosity and material optical properties.
To demonstrate the Particle Concentration measurement, a dispersion of 60 nm diameter polystyrene spheres in an aqueous solution of sodium chloride (10 mM) was prepared for the Zetasizer Ultra. The particle concentration was theoretically calculated based on the stock mass concentration, the density and the dilution factor. A series of 20 repeat Particle Concentration measurements was carried out. Each measurement took approximately 3.5 minutes. The total particle concentration was measured to be 8.13±0.68 x 10¹¹ particles/ml. The results are tabulated in Table 1 and shown in Figure 2.
| Total Particle Concentration (particles/ml) | Uncertainty (1σ) (particles/ml) | |
|---|---|---|
| Calculated
| 6.74 x 10¹¹ | 1.02 x 10¹¹ |
| Measured | 8.13 x 10¹¹ | 0.68 x 10¹¹ |
Table 1: Calculated and measured particle concentration
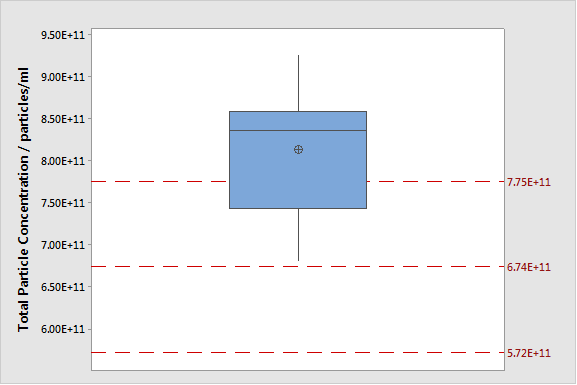
Figure 2: Boxplot of measured Total Particle Concentration. The expected concentration is depicted by the reference lines (mean with upper and lower uncertainties).
An example of the particle concentration charts produced by the Zetasizer Ultra is shown in Figure 3. From the distributed particle concentration chart, it is possible to quantify the concentration of an additional population (likely to be some aggregated material) with a size approximately 500 nm and a concentration between 4 and 5 orders of magnitude less than the main population. The cumulative particle concentration chart shows the total number of particles present. Due to the underlying sensitivity of dynamic light scattering to large particulates, this technique can evaluate the concentration of very small numbers of aggregated particulates as well as that of the monomer. The volume-weighted particle size distribution is shown in Figure 1.
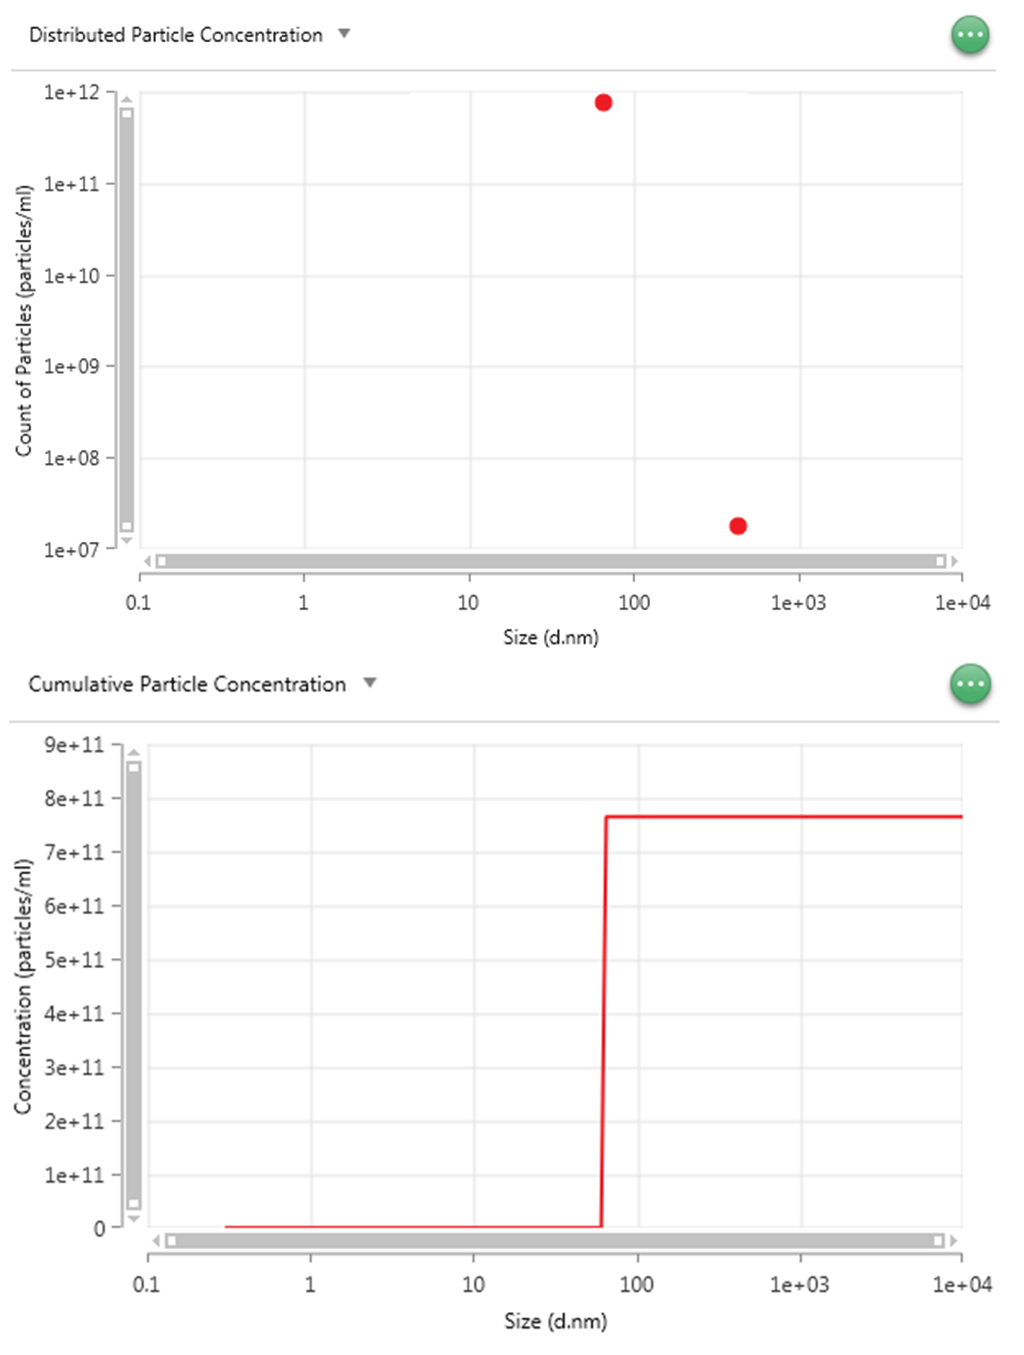
Figure 3: Distributed Particle Concentration chart (top) and Cumulative Particle Concentration chart (bottom)
The particle concentration of a standard sample has been measured and the result is in reasonable agreement with the theoretically calculated value. The accuracy is typically several tens of percent which, combined with the short measurement time and the ability to measure multiple sample types, makes the technique ideally suited to screening-type measurements.
The improved resolution and accuracy in the MADLS particle size distribution over and above a single angle DLS measurement increases the accuracy of the concentration distribution because of the uncertainty that is introduced by errors in the particle size. Since the measurement uses MADLS, the concentration range is restricted because the requirements of each measurement angle must be satisfied. For example, turbid samples are not suitable because such samples require NIBS technology which is possible in backscatter only.
The method of retrieving the particle concentration distribution from the MADLS particle size distribution has been explained for interested users. The technique involves a transformation of the intensity-weighted particle size distribution into the absolute concentration distribution using the derived count rate and the optical properties of the material and dispersant. Liquid toluene is used as a reference scatterer to normalize the detected photon count rate against the absolute scattered intensity.
Using this method, the particle concentration distribution (the concentration of each size population within the sample) is produced, as well as the total concentration. The measurement retains the underlying advantages of DLS such as short measurement time, fast sample preparation and flexibility across sample types.
[1] C. F. Bohren and D. R. Huffman, 1983, Absorption and Scattering of Light by Small Particles, John Wiley & Sons, Inc.