Protein therapeutics, including monoclonal antibodies and other biologics, are highly sensitive to changes in formulation, concentration, temperature, pH, ionic strength, and manufacturing conditions. Even subtle shifts in protein aggregation state, hydrodynamic size, or surface charge can affect product quality, safety, efficacy, manufacturability, and long-term stability. As biologic formulations move from early development into scale-up and routine manufacturing, pharmaceutical scientists need robust analytical methods that can detect changes in colloidal behavior before they become critical quality concerns.
High-concentration protein formulations are increasingly important in biopharmaceutical development, particularly for therapeutic antibodies. However, these formulations can be difficult to characterize because concentration-dependent effects may influence light scattering measurements. Multiple scattering, bulk viscosity, restricted diffusion, virial effects, and reversible or irreversible self-association can all affect the apparent size, polydispersity, and correlation function measured by dynamic light scattering.
Without careful interpretation, an apparent increase in protein size may reflect increased solution viscosity rather than true aggregation. Similarly, attractive or repulsive protein-protein interactions can influence the measured diffusion behavior. Understanding these effects is essential for distinguishing genuine aggregation from concentration-related measurement artifacts and for identifying formulation conditions that maintain favorable colloidal stability.
Dynamic light scattering (DLS) provides a rapid, non-destructive method for measuring the hydrodynamic diameter or radius of proteins and other particles in solution. In the whitepaper, DLS is described as a trusted technique for batch control, scale-up, troubleshooting, and routine biopharmaceutical manufacturing. When combined with non-invasive backscatter (NIBS) detection, DLS can support measurements across a broad concentration range, including high-concentration protein formulations.
DLS is especially useful because it is highly sensitive to the presence of larger particles and aggregates. Since scattering intensity increases strongly with particle size, even trace levels of larger aggregates can contribute significantly to the measured signal. This makes DLS valuable as an early indicator of aggregation onset and changes in dispersion quality during formulation development, process transfer, or manufacturing.
The whitepaper outlines how DLS can be used alongside complementary light scattering approaches to build a more complete understanding of protein stability. Size measurements can be performed across different protein concentrations to assess concentration-dependent behavior. Thermal ramping experiments can be used to monitor changes in Z-average size and polydispersity as temperature increases, helping determine the aggregation onset temperature, Tonset.
In addition to size and aggregation onset, DLS can be used to evaluate the diffusion interaction parameter, kD, which provides insight into protein-protein interactions in solution. The measured diffusion coefficient, D, can be evaluated as a function of concentration, with D0 representing the self-diffusion coefficient at zero concentration. The parameter kD is related to the second virial coefficient, B22, as well as the molecular weight, Mw, the first-order concentration coefficient of friction, kf, and the partial specific volume of the solute.
For biopharmaceutical workflows, DLS provides practical relevance from early formulation screening through quality control. During early development, DLS can help identify formulation conditions that reduce aggregation risk and support favorable protein-protein interactions. During scale-up, DLS and zeta potential measurements can support batch-to-batch comparability by verifying that processes such as mixing, filtration, buffer exchange, or sterilization have not introduced unwanted changes in aggregation behavior or dispersion quality.
In routine manufacturing and QC environments, DLS can support trend monitoring, troubleshooting, and out-of-specification investigations. When unexpected turbidity, visible particles, or out-of-trend results occur, DLS can help confirm whether the issue is associated with a true shift in colloidal state or with sample handling, filtration, or process-related variability. This makes DLS an important contributor to a broader Quality by Design strategy, where critical quality attributes and process parameters are monitored throughout the product lifecycle.
Download the full whitepaper to explore how dynamic light scattering, non-invasive backscatter detection, thermal ramping, kD, B22, Tonset, and complementary biophysical measurements can be applied to better understand the colloidal stability of protein therapeutics from development to routine manufacturing.
Login or register to download the whitepaper.
Robust control of protein properties has become essential for modern pharmaceutical manufacturing. In biopharmaceuticals, changes in protein aggregation state, particle size, or surface charge can have a direct impact on safety, efficacy, and manufacturability. In addition, for pharmaceuticals, the size, shape, and chemical identity of particles influence content uniformity, dissolution, and bioavailability.
Zetasizer dynamic light scattering (DLS) systems support this control across scale-up, routine production, and batch release. DLS addresses both colloidal behavior in solution and particle identity in the final product, providing a stronger control strategy for biologics, including protein therapeutics.
Dynamic light scattering (DLS) using noninvasive backscatter (NIBS) detection technology enables the measurement of the hydrodynamic radius of proteins over a large concentration range (0.1 mg/mL to 100 mg/mL). DLS helps to characterize colloidal stability from early development to formulation, production, and QC. As a result, it is possible to determine, in early and formulation development, the bulk viscosity/restricted diffusion interaction parameter (kD), particle interaction parameter (B22), melting temperature, onset temperature of protein aggregation, and transition enthalpies.
As the demands of biologics development continue to evolve, so too does the need to apply these powerful techniques at greater speed and scale. The future of formulation screening lies in high-throughput platforms that can deliver the same depth of biophysical insight across small volumes of samples simultaneously, a capability that is rapidly becoming essential for modern biopharma workflows.
In QC laboratories, Zetasizer technology is widely used for rapid, non-destructive characterization of nanoparticle and biomolecular size, polydispersity, and zeta potential. These measurements give sensitive early warning of changes in aggregation behavior or dispersion quality that may arise during process transfer, scale-up, or long-term manufacturing. Automated workflows, robust hardware, and software compliant with data integrity expectations make Zetasizer systems suitable for multi-batch trending and release testing in GMP environments.
Dynamic light scattering (DLS) is a trusted technique in solution for batch control, scale-up, and troubleshooting, as well as for determining the hydrodynamic diameter of biotherapeutic proteins, sample polydispersity, and interactions in routine biopharmaceutical manufacture. It also detects changes in surface charge that may indicate shifts in formulation composition, pH, or process conditions, providing an early alert to potential stability issues.
During scale-up, comparison of DLS and zeta potential data from engineering and commercial batches helps confirm that mixing, filtration, or sterilization steps have not introduced additional aggregates or altered dispersion quality. When an out-of-trend result is detected, DLS can rapidly distinguish between a genuine change in aggregation state and issues related to sample handling or filtration, enabling batch-to-batch trending and early detection of shifts in aggregation propensity during process transfer or scale-up – supporting efficient root cause analysis.
Alongside these established capabilities, complementary techniques such as static light scattering (SLS) and intrinsic differential scanning fluorimetry (DSF) are increasingly being applied in tandem with DLS to build a more complete picture of both colloidal and structural stability from a single sample.
Here, we describe the utility of DLS to help understand the colloidal stability of protein therapeutics from early development through to routine manufacturing.
Malvern Panalytical’s Zetasizer Advance instrument provides DLS (colloidal stability), integrating proprietary non-invasive backscatter (NIBS) detector technology with dynamic (DLS), static (SLS), and electrophoretic (ELS) light scattering to measure the hydrodynamic radius of proteins from 0.3 nm – 10 µm, at concentrations from 0.1 mg/mL to ≥ 100 mg/mL. For higher resolution and more detailed insight into heterogeneous samples, multi-angle dynamic light scattering (MADLS) can be applied to improve discrimination of size populations and reveal subtle shifts that may be masked in conventional DLS measurements. Thermal ramp studies are conducted by collecting DLS data over a series of pre-defined 0.1 °C – 5 °C step-wise increments. Isothermal incubation studies are conducted by collecting a series of DLS data over a predefined time interval at a desired temperature set-point.
This multi-parameter approach with DLS is specifically important for formulation screening, where DLS enables the identification of solution conditions that optimize colloidal stability and reduce the risk of protein self-association. In the manufacturing environment, these measurements provide a sensitive batch-to-batch control strategy, allowing rapid verification of product consistency and supporting troubleshooting when deviations arise during scale-up or routine release testing.
While this cuvette-based approach remains the gold standard for in-depth characterization, the same underlying DLS and SLS measurement principles can, in principle, be applied at much higher throughput, opening the door to screening dozens or hundreds of formulation conditions in the time traditionally required for a single thermal ramp study.
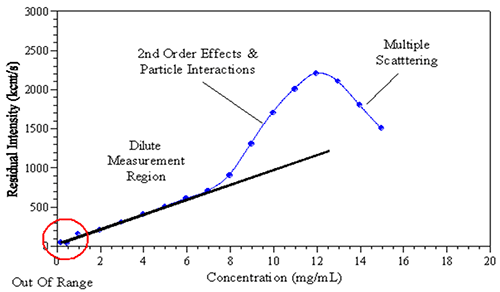
The formulation of monoclonal antibodies at high concentrations has drawn great attention within the biopharmaceutical industry in recent years. However, for DLS, size measurement at formulated concentrations was limited by multiple experimental factors. As shown in Figure 1, increasing sample concentration could affect the observed scattering intensity and consequently the size determination. Factors affecting the measurement could include: multiple scattering, viscosity, positive/negative virial effects, and self-association. Deconvolution of the above effects allows for the interpretation of high-concentration sample results.
To better understand the effects of the aforementioned factors on the DLS data, it is convenient to consider an individual effect in isolation. Table 1 (below) summarizes the expected changes with increasing sample concentration to the reported size, polydispersity, and correlation function, as well as established correction methods, for each of the unwanted factors.
| Factors | Apparent Size | Apparent Polydispersity | Correlation Intersection | Correction Method |
|---|---|---|---|---|
| Multiple Scattering | Decrease | Increase | Decrease | Backscattering |
| Restricted Diffusion | Increase | No Change | No Change | Viscosity Correction |
| Negative B22 | Increase | Increase | No Change | No |
| Positive B22 | Decrease | No Change | No Change | No |
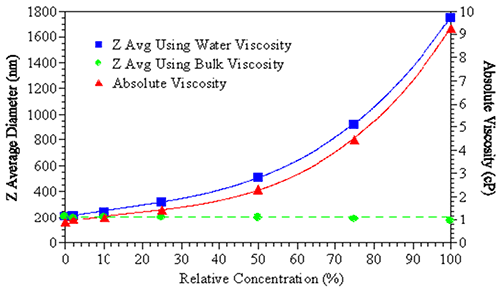
Figure 2 (below) demonstrates the effect of viscosity correction on the reported size of a sample. Using the viscosity of water as an estimate of the sample viscosity results in an increase in the apparent size of the suspended particles (blue squares). However, when the true bulk solution viscosity is used to correctly fit the DLS results, no apparent size change is observed (green circles). Particle interaction terms, including attractive/repulsive, B22 (second virial coefficient) or kD (diffusion interaction parameter) could be indicated and will be covered in the following section. It should be noted that for virial effects, there is currently no agreed-upon approach to correct DLS data.
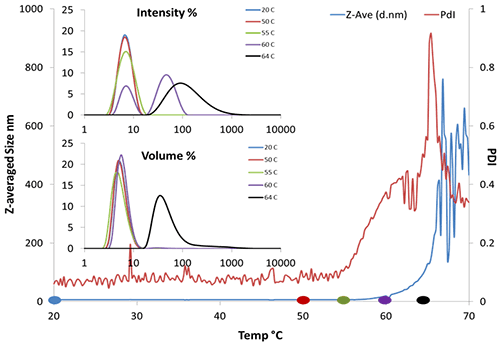
Static light scattering (SLS) or turbidity coupled with thermal ramping have been routinely used as rapid formulation screening tools for protein stability. Essentially, these methods measure the aggregation onset temperature Tonset. DLS could also be utilized in this fashion. Figure 3 shows the aggregation onset for BSA is approximately 62 °C by Z-averaged size. Additionally, as long as the correlogram remains valid, DLS offers the size distribution (Fig. 3, insert) and polydispersity (PDI), where SLS offers only the intensity. The size distribution trend shown here clearly reveals the appearance of a second peak at 90 nm near 60 °C. The onset temperature from PDI could be as early as 55 °C, indicating aggregation may begin even earlier.
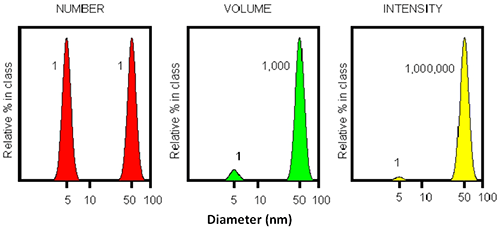
The ability to detect trace amounts of aggregates stems from the inherent sensitivity of DLS. Figure 4 demonstrates that for a simple 1:1 mixture of two particles with an order of magnitude difference in diameter, the larger 50 nm particle will show a scattering intensity a million times stronger than the smaller 5 nm particle (shown in yellow). This infers that even a single large particle mixed with a million small particles results in an equal detected intensity. Thus, DLS could be useful as the earliest detector for the appearance of aggregates. However, it should be noted that the resolution of DLS is inherently limited to a factor of three in size. When a more detailed resolution is required, MADLS extends this capability by improving the analysis to a factor of two in size for an optimal sample.
The sensitivity and information density of DLS-based aggregation onset detection makes it particularly well-suited to high-throughput screening contexts, where identifying the optimal formulation conditions early can save significant time and resources downstream.
Though Tonset might be sufficient for initial formulation screening, no understanding of protein interaction can be reached from such experiments, let alone the prediction of protein stability. Recently, more attention has been focused on investigating intermolecular parameters as predictors of protein aggregation kinetics, which have been successfully correlated with B22 and kD [1]. A large positive value of B22 indicates that solutes prefer association with the solvent over self-association, either due to strong electrostatic repulsion between solute molecules or positive interaction between solute and solvent. In contrast, large negative values of B22 indicate strongly self-attractive systems, where the particles prefer self-association or aggregation over complete solvation.
In the case of DLS, kD can be measured directly and is related to B22 by the following equations [2]:
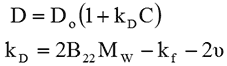
Here, C is the sample concentration, and D refers to the diffusion coefficient measured by DLS. D0 is the self-diffusion coefficient (the value of D at zero concentration). Mw is the sample molecular weight, kf is the first-order concentration coefficient of the friction, and ν is the partial specific volume of the solute.
The following experiments demonstrate how to apply kD to predict the protein stability for an IgG in four formulations. In Figure 5, only formulation 2 (Soup 2) (red circles) has a positive kD, indicating a strong repulsive interaction between the protein samples. The other three samples show slightly negative kD. It should be mentioned that large positive kD usually indicates strong repulsive interactions, or positive B22. However, when kD is close to zero it becomes difficult to directly link to B22.
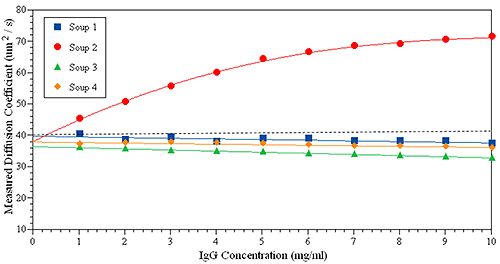
SLS can be measured at a fixed angle for B22, and zeta potential is measured to provide relative charge, as summarized in Table 2. Putting all of the information together, a comprehensive profile of protein properties can be obtained to predict protein stability.
For example, we would predict that formulation 2 is the most stable formulation for this IgG because of the strong repulsive interaction, while formulation 1 is the least stable one, showing the lowest Tonset of aggregation formation.
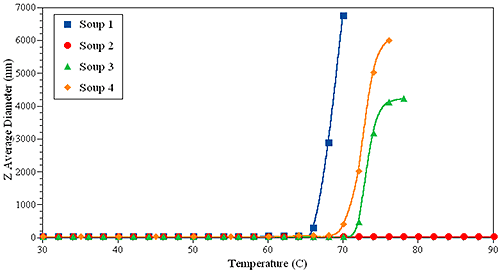
To support this prediction, thermal ramping experiments were performed on the same set of formulations, and are shown in Figure 6. Interestingly, formulation 1 has the lowest Tonset, close to 66 °C, while formulation 2 is the most stable, showing no evidence of large aggregates up to 90 °C.
| IgG Formulation | B22 (10-5 ml mol/g2) | kD (ml/g) | Charge |
|---|---|---|---|
| Soup 1 | -1.5 | -5.2 | 3.3 |
| Soup 2 | 127.5 | 31.9 | 9.7 |
| Soup 3 | 10.4 | -9.7 | 5.1 |
| Soup 4 | 2.3 | -4.7 | -2.8 |
The ability to derive kD, B22, and Tonset from the same measurement workflow highlights the value of platforms that can run these multi-parameter assessments in parallel across large sample sets. Integrating DLS and SLS with structural stability readouts such as DSF in a single, scalable system could offer a step change in both the speed and depth of formulation characterization.
After a biopharmaceutical product has been scaled up and moved into production, the same biophysical characterization methods used during development and formulation continue to play an important role in confirming compliance with manufacturing and quality requirements. Implementing a Quality by Design (QbD) strategy early in development, including the definition of critical quality attributes and critical process parameters, helps ensure that key biophysical properties such as aggregation are monitored and controlled throughout the product lifecycle.
Here, we have described how DLS, when combined with noninvasive backscatter detector (NIBS) technology, provides a powerful approach for formulation development by generating key colloidal stability parameters such as the bulk viscosity/restricted diffusion interaction parameter (kD), the particle interaction parameter (B22), melting temperature, onset temperature of aggregation, and transition enthalpies in high-concentration formulations. Together, these measurements help identify formulations that maintain favorable protein-protein interactions and minimize aggregation risk, thereby supporting the selection of robust candidates for later-stage development and manufacturing.
DLS delivers speed, sensitivity, and trendability for routine monitoring, strengthening troubleshooting, supporting batch-to-batch comparability, and enhancing confidence in contamination control, batch release, and biologics manufacturing decisions. For pharmaceutical scientists working with biologics and advanced formulations, this enables faster decision-making, stronger troubleshooting, and a more comprehensive control strategy from development through manufacturing.
An orthogonal and complementary instrumentation strategy is essential at every stage of the biopharmaceutical workflow, because no single method can fully capture protein stability, particle identity, and process-related variability from candidate selection through manufacturing control. Looking ahead, the integration of these complementary techniques into high-throughput, plate-based platforms capable of delivering DLS, SLS, and intrinsic fluorescence-based stability data simultaneously promises to transform how the industry approaches early-stage formulation screening. As the biologics development landscape accelerates, so must the tools that support it.
Learn more about how this approach can help: