Oral Solid Dosage (OSD) forms still represent a significant share of the pharmaceutical market. As a result, they remain an important target for generic product developers. OSD products tend to be viewed as simpler to reverse engineer compared to those with more complex delivery mechanisms, such as Orally Inhaled and Nasal Drug Products (OINDPs). However, deformulation - the unpicking and rationalization of those characteristics of a Reference Listed Drug (RLD) that deliver its performance - still requires significant effort, especially when considering modified or sustained release OSD products. In addition, the development of a new generic can be an intensely competitive process, with multiple companies chasing the opportunity to be first to file in the US in order to claim a highly valuable period of exclusivity. Optimizing the deformulation workflow to accelerate submission and secure regulatory approval is therefore an important goal.
The FDA’s Critical Path Opportunities for Generic Drugs [1] guides the workflow associated with generic development, and emphasizes the need to adopt a Quality by Design (QbD) approach. QbD calls for the development of a sound understanding, and robust control, of all the variables that impact product and process behavior. This creates a need for extensive information gathering from the outset. The guidance clearly recognizes the role of analytical technology in delivering relevant information, and calls for advances in the analytical technology used in characterizing drug substances and products.
In this white paper Dr Deborah Huck-Jones and Dr Paul Kippax examine the deformulation workflow, demonstrating the value of the technique of Morphologically Directed Raman Spectroscopy (MDRS) within this context. Case studies illustrate the relevance of MDRS data.
The complexity of generic OSD development is increasing steadily as innovators push back the boundaries of pharmaceutical engineering to formulate products with precisely controlled clinical performance. This situation is acknowledged by the FDA, which has openly stated that “In the characterization stage, some generic products are challenging to develop because of the complexity of the reference product.” Fully understanding and rationalizing every aspect of the performance of an RLD is an essential precursor to the development of a generic that is both safe and effective.
The potential for incomplete understanding to result in poorly controlled clinical efficacy is exemplified by the phenomenon of ‘dose dumping’ as a result of elevated blood alcohol levels [2]. There is growing evidence that alcohol consumption can impact the controlled release performance of OSD formulations causing the drug to be released over a much shorter timescale than the design intent. This results in a higher peak in drug concentration in the blood than would otherwise have occurred, with the associated potential for an adverse clinical effect. This concern points to new assessment requirements for both innovator and generic products and illustrates the extensive studies needed to fully scope OSD performance.
To promote the necessary rigor in generic development there is now a regulatory requirement to demonstrate a QbD approach when working towards an Abbreviated New Drug Application (ANDA). A QbD approach focusses initially on identifying a Quality Target Product Profile (QTTP) for the product - a definition of its clinical performance. In the case of generics this target is most usually bioequivalence with the target RLD. The next steps involve systematic assessment of the variables that impact the QTPP and the development of strategies that will control these critical quality attributes (CQAs).
Effective deformulation builds the understanding that underpins this QbD approach and is driven by relevant analytical information. In many cases this means that the analytical technology required for deformulation needs to be even more sophisticated than that used during development of the RLD itself. An examination of the deformulation workflow focuses attention on the information that is needed.
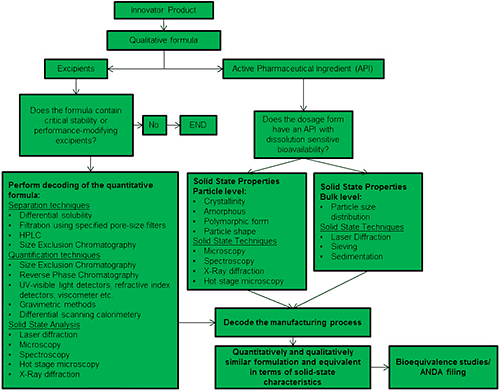
Figure 1 shows a generally accepted OSD deformulation workflow, originally developed by Dr Arvind K Bansal, Professor and Head of Department of Pharmaceutical Education and Research (NIPER), India. The deformulation workflow derives from and mirrors the approach taken in the formulation of new products, as enshrined in ICHQ8 (R2) [3], however the context of deformulation results in a more constrained process. Many of the discrete activities in deformulation and formulation are shared but rather than beginning with a ‘blank canvas’, deformulators must start by fully understanding exactly how an RLD delivers the clinical performance associated with it. The schematic highlights the need to separately analyze the characteristics and role of the excipients and of the API within the product, and to decode the processing conditions applied during manufacture.
|
One core element of the deformulation process, displayed on the left hand side of figure 1, is to identify the CQAs for the excipients. Excipients can be added simply to increase the bulk of the formulation, in which case they may have no direct impact on product stability or performance. Increasingly, though, excipients are used to impart functionality; controlled release agents, stabilizers and surface active agents being prime examples. Where this is the case it is necessary to separate or differentiate the excipient from other components of the blend, in order to gather information about it. Separation techniques such as gel permeation/size exclusion chromatography (GPC/SEC) and solid state characterization methods such as laser diffraction and analytical imaging all provide data that can be used to rationalize the performance defining features of excipients.
A parallel activity involves decoding and defining the functionality of the active pharmaceutical ingredient(s) (API). Solid state characterization is essential, especially when bioavailability is influenced by the solubility profile of the API. Here laser diffraction, analytical imaging and spectroscopy are applied to determine characteristics such as:
The final step in the deformulation process is to decode the manufacturing process in order to determine how the excipients and API(s) are brought together to consistently produce an OSD that meets the defined specification. Here, too, data for individual components within the formulation can be helpful. For instance, the shape of an API may be affected by the size reduction process used to produce it, in which case particle shape data will provide clues as to the specific processing method employed. Such insight supports the development of an OSD product that will perform in a similar way to an RLD. The rigorous demonstration of bioequivalence ensures that this goal has been met and is the final preparatory step for an ANDA.
As highlighted above, a key requirement of the deformulation workflow is to obtain component specific data regarding the size and shape of any functional excipients and APIs present within an OSD formulation. This requires access to an analytical technique which can not only extract morphological information but can also classify materials within a sample based on their chemistry.
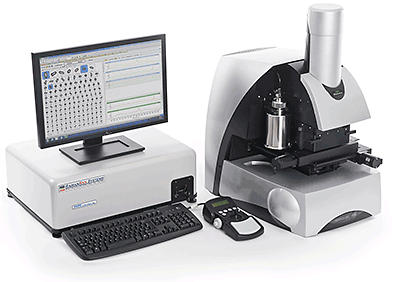
One technique which enables component specific data to be obtained for multi-component samples is Morphologically Directed Raman Spectroscopy (MDRS), a technique made possible by the capabilities of systems such as the Morphologi G3-ID from Malvern Instruments. This instrument combines the capabilities of automated analytical imaging, which can gather statistically relevant size and shape data, with the capabilities of Raman spectroscopy, which can be used for component identification.
The Morphologi G3-ID provides size, shape and chemical analysis information for particles in the size range 1 µm – 1000 µm and can be applied to a variety of sample types including dry powders, suspensions and creams. It automatically scans a dispersed sample and captures images of individual particles, from which particle size and shape data can be extracted. These data can then be used to identify particles for analysis Raman spectroscopy, enabling the chemical identification of discrete populations within multicomponent mixtures. In this way, MDRS can be used to differentiate an excipient or API within a formulated tablet and then to gather critical information about that individual component. The following case studies provide specific examples of the types of study that support efficient deformulation.
|
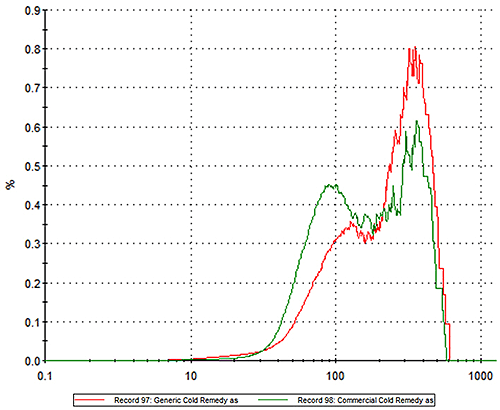
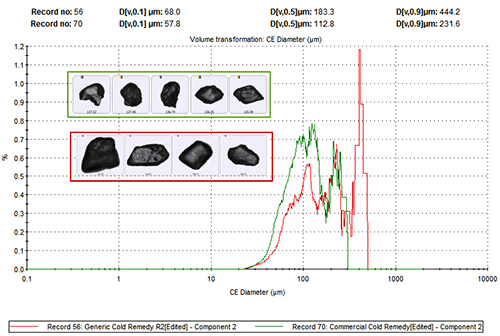
In an experimental study, two commercially available powder based flu treatments, one branded, the other generic, were analyzed using MDRS. In the first step of the experiment particle size distribution data were measured for each product. Figure 1 shows the particle size distribution for the innovator (green) and generic products (red) overlaid on the same graph. The results show clear differences between the two products. The innovator product has more particles in the 20 -100 micron region while the generic alternative contains a higher proportion of larger particles.
|
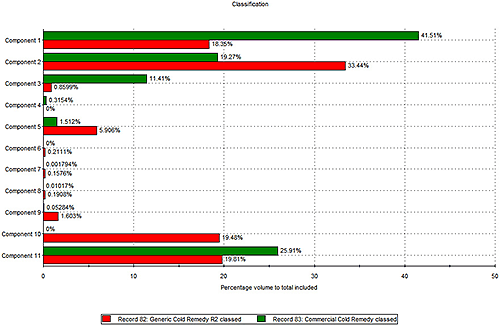
In the next step of the experiment Raman spectroscopy was applied to identify different chemical components within the two formulations. Figure 2 shows the relative proportions of a number of different components within each remedy. It is important to note that, as this chart suggests, measuring the relative amounts of each component does not rely on knowing what that component is. At this stage the spectroscopic data have simply been used to differentiate 11 chemical components within the formulation and to quantify the relative amount of each, in each sample.
|
The results in figure 2 reveal further differences between the two products. The components that represent the biggest percentage by volume in both products are components 1, 2 and 11. The branded product contains a greater percentage of component 1 than the generic, which in contrast contains more of component 2. Furthermore the generic contains trace quantities of a number of components that are absent from the branded remedy.
Using a spectral library database, or a process of structural elucidation, it is possible to identify these detected components. Through comparison with reference spectra component 1 was revealed to be a form of sucrose, while component 2 was found to be one of the active ingredients - paracetamol. These data therefore suggest that the generic contains more of the active component than the branded remedy.
To investigate this arguably counter-intuitive result further analysis was carried out to assess whether there were additional differences in the physical characteristics of the paracetamol in each sample that might impact the clinical efficacy of the product. Figure 3 shows particle size distribution data (circular equivalent diameter – CED) for the paracetamol, for both formulations. These distributions were generated by including only data related to particles that had been securely classified as being component 2 on the basis of spectroscopic analysis.
|
These data reveal that the branded product contains finer paracetamol particles than the generic. Both flu remedies must be dissolved before administration, so this difference in particle size may directly impact their clinical effect by altering the dissolution rate of the API.
As well as differentiating APIs from excipients in a blend or RLD, Raman spectroscopy can also detect different polymorphs of an API. Many APIs have multiple polymorphic forms and these can behave differently in vivo. Innovator products are often formulated with the most stable polymorphic form to avoid any complications caused by polymorph transformations during processing and storage. Identifying the polymorphs present within an RLD is therefore critical during deformulation.
|
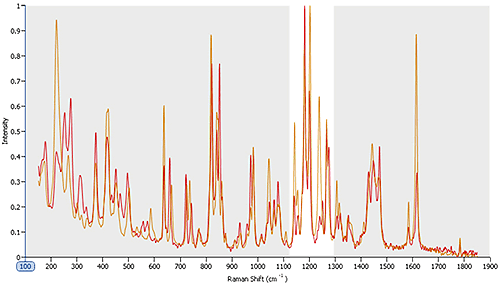
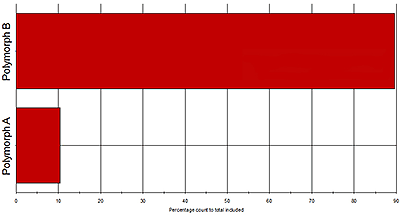
Figure 6 shows Raman spectra gathered for two polymorphs within an API sample. Looking across the area shaded in grey it is clear that many of the peaks are recorded at the same wave numbers for both polymorphic forms. However, in the area highlighted in white, between wave numbers 1100 and 1300, there are clear spectral differences. These can be used to securely identify particles as being one polymorph or the other, and to quantify the relative abundance of each in the sample (see figure 5). The results indicate that the polymorphs are present in the ratio 9:1.
|
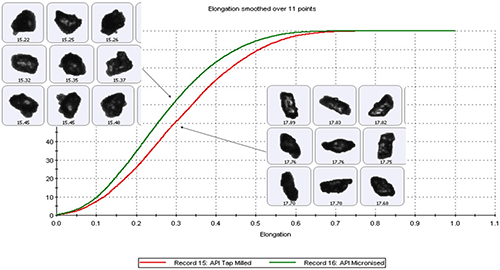
The ability to obtain morphological data specifically for the API using techniques such as MDRS can provide valuable clues as to the manufacturing methods used to produce the API in the first instance. For example, figure 8 shows particle shape data, elongation distributions, measured for two samples of the same API processed using different size reduction methods.
|
Elongation is a measure of particle form and is defined by the formula [1 – width/length]. Needle-shaped particles have an elongation close to 1 while those that are more regularly shaped have much lower values. The data presented in figure 8, and the accompanying images, show that API particles that have been subject to size reduction by tap milling have higher elongation values than those produced by micronization. These data are directly helpful in decoding the manufacturing process used to produce the API, and may aid selection of possible processing partners.
Furthermore the data highlight that selection of the wrong processing technique could result in a formulation that would fail to deliver bioequivalence, as the surface area and possible dissolution rate of the particles produced using each process method are different. The shape of differences could also directly impact the flowability and compressibility of the tablet formulation, thereby affecting the quality and performance of the finished product.
The need to unpick and rationalize the performance of increasingly complex OSD products creates a requirement for new analytical techniques that provide the necessary insight. Combining automated imaging with Raman spectroscopy enables application of the powerful technique of MDRS which provides information about particle size, shape and chemical identification. The case studies presented here demonstrate how this information can be used to efficiently advance through the deformulation workflow and aid the preparation of a successful ANDA submission.